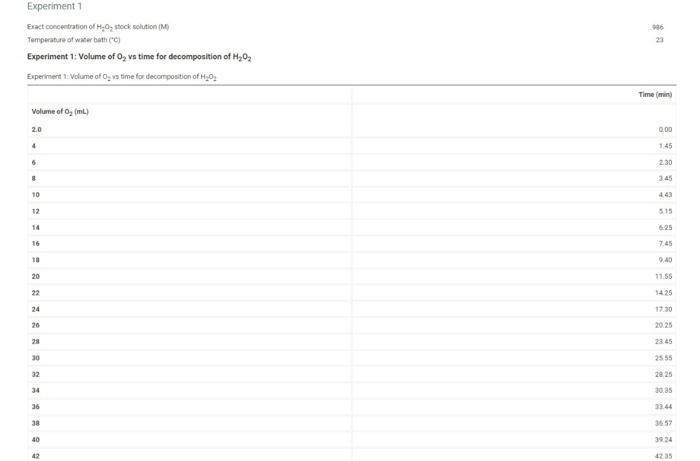
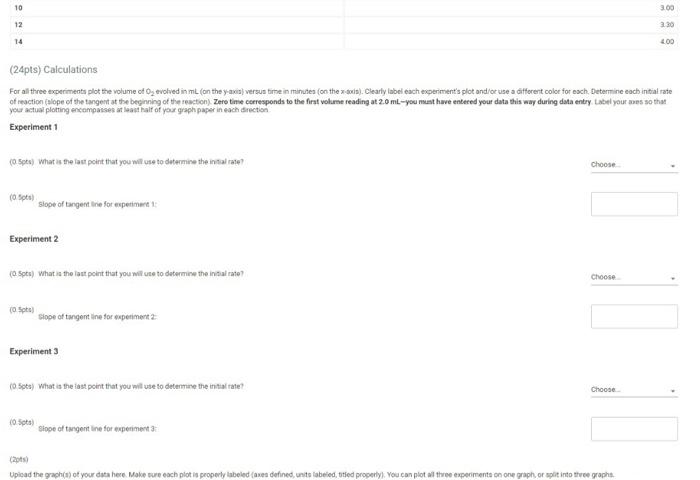
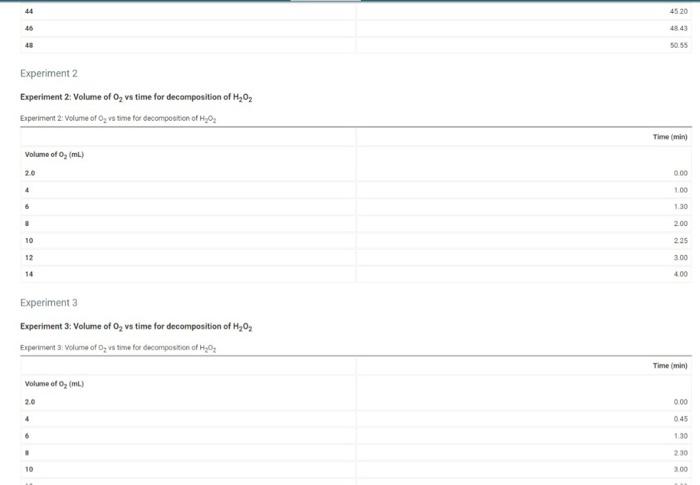
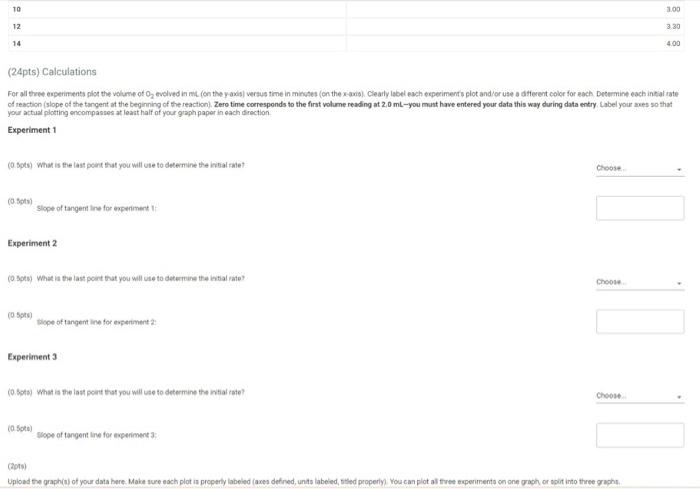
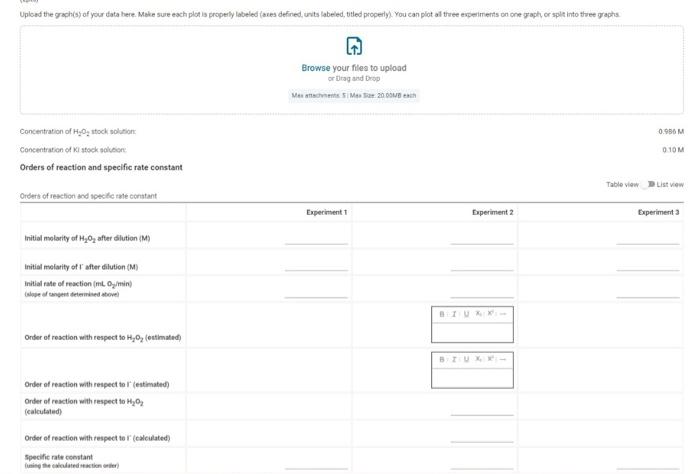
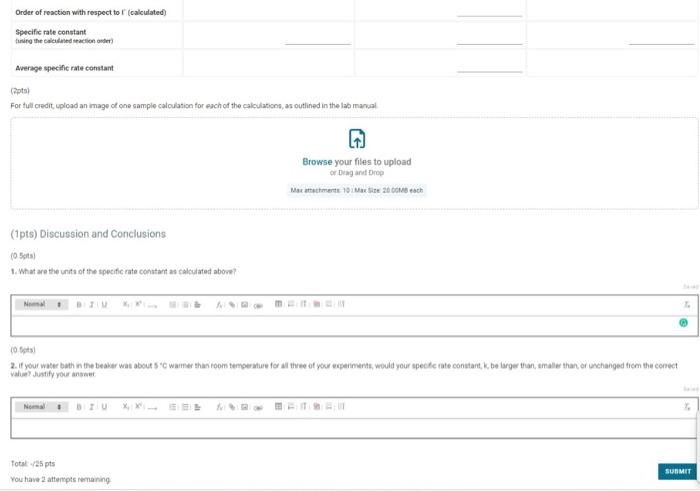
900 Experiment1 Exact concentration of Hon stock solution (M Temperature of water bath C) Experiment 1: Volume of O, vs time for decomposition of H2O2 Experiment 1: Volume of a time for decomposition of 1,0 Time Volume of o, mL) 2.0 0.00 4 1.45 9 230 8 3.45 10 443 12 515 14 6:25 16 7.45 18 9.40 20 11.55 22 3425 24 17.30 26 20:25 28 23.45 30 2555 32 SE BZ 34 3035 33.44 36 38 3659 40 39.24 42 123 10 300 12 330 14 400 (24pts) Calculations For all three experiments plot the volume of O evolved in ml (on the y-axis versus time in minutes (on the is). Clearly label each experiment's plot and/or use a different color for each, Determine each initial rate of reaction (slope of the tangent at the beginning of the reaction) Zero time corresponds to the first volume reading at 2.0 mL-you must have entered your data this way during data entry Label your wes so that your actual plotting encompasses at least half of your graph paper in each direction Experiment1 (0.5p) What is the last point that you will use to determine the initiale? Choose (0 pts) Slope of tangent line for experiment 1 Experiment 2 (0 Spts) What is the last point that you will use to determine the initial rate? Choose (0 Spe slope of tangent line for experiment 2 Experiments to ste) What is the last point that you will use to determine the initiatate? Choose 10.5pts stope of targentine for experiment 3 Upload the graphs of your data here. Make sure each plotis properly labeled es defined units labeled, titled properly. You can plot all three experiments on one graph or split into three graphs 44 4520 46 48.43 50.55 Experiment 2 Experiment 2: Volume of O, vs time for decomposition of H2O2 Experiment 2 Volume of O, vs time for decomposition of _, Time mind Volume of O, (m) 0.00 4 100 6 1.30 . 2.00 10 225 12 300 14 400 Experiment a Experiment 3: Volume of O, vs time for decomposition of H20 Experiment Volume of 5, vis time for decomposition of H202 Time mini Volume of 0, (m) 2.0 000 4 045 6 130 230 10 100 10 11.00 12 3.30 14 4.00 (24pts) Calculations For all three experiments plot the volume of o, evolved in ml.(on the yaxia) versus time in ministes (on the wario). Clearly label each experiments plot and/or use a different color for each Determine each initial rate of reaction (slope of the tangent at the beginning of the reaction). Zero time corresponds to the first volume reading at 2.0 mL-you must have entered your data this way during data entry Label your ses so that your actual plotting encompasses at least half of your graph paper in each direction Experiment1 (0.5pts) What is the last point that you will use to determine the initial the Choose (0. slope of tangent tre for experiment Experiment 2 (9. spery What is the last point that you will use to determine the bottal rato? Choose (05) slope of tangentina for experiment 2 Experiment 3 (0.8t) What is the last point that you will use to determine the initial rate? Choose (0 sota slope of tongent line for experiment : (2015) Upload the graph of your data bere. Make sure each plotis properly labeled axes defined units labeled, led properly. You can plot alreexperimento on one grahor into three grah Upload the grach() of your data bere. Make sure each plot la properly labeled (anes defined, units labeled, tiled properly. You can plot all three experiments on one straply or spre into twee spacha Browse your files to upload or Drag and drop Meri Me20 0.96M Concentration of stock solution Concentration of stock solution Orders of reaction and specific rate constant 0 10M Table view List View Orders of reaction and specific rate constant Experiment1 Experiment 2 Experiment Initial melarity of H40, after dilution (M) Initial marity of later dilution (M) Initial rate of reaction (ML/min woelwangent determined above Order of reaction with respect to H,0, (ostimated Order of reaction with respect to estimated) Onder of reaction with respect to My02 (calculated) Order of reaction with respect to realculated) Specificate constant urine as talendar ) Order of reaction with respect to calculated) Specific rate constant in the seated action de Average specific rate constant (pts For full credit upload an image of one sample calculation for each of the calculations, as outlined in the lab manual Browse your files to upload of bong and Drop Master Marie 200 each (1pts) Discussion and Conclusions (05 1. What are the units of the specific rate constant as calculated above? (0) 2. If your water both in the beaker wat about 5 warmer than room temperature for three of your experiment would your specific rate constant, k. belgethan, smaller than or changed from the connect value Justify your an Total 25 pts You have attempts remaining SUBMIT
