

Answered step by step
Verified Expert Solution
Question
1 Approved Answer
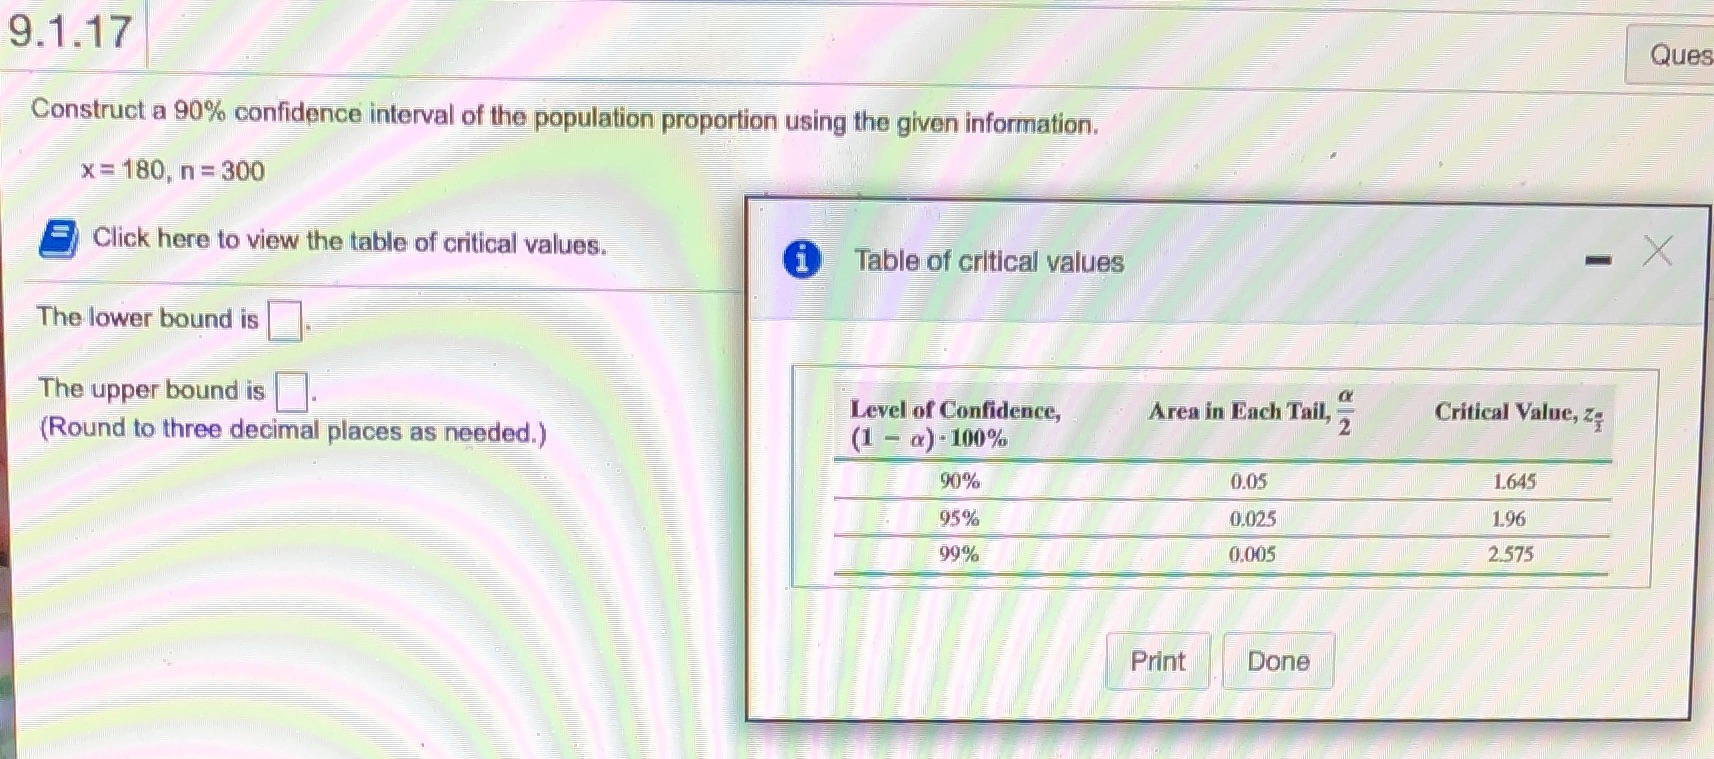
9.1.17 Ques Construct a 90% confidence interval of the population proportion using the given information. x = 180, n = 300 Click here to view

Step by Step Solution
There are 3 Steps involved in it
Step: 1

Get Instant Access to Expert-Tailored Solutions
See step-by-step solutions with expert insights and AI powered tools for academic success
Step: 2

Step: 3
Ace Your Homework with AI
Get the answers you need in no time with our AI-driven, step-by-step assistance
Get Started
WebAssign For Applied Calculus For The Life And Social Sciences, Enhanced Edition
Authors: Ron Larson
1st Edition
1337768197, 9781337768191