Answered step by step
Verified Expert Solution
Question
1 Approved Answer
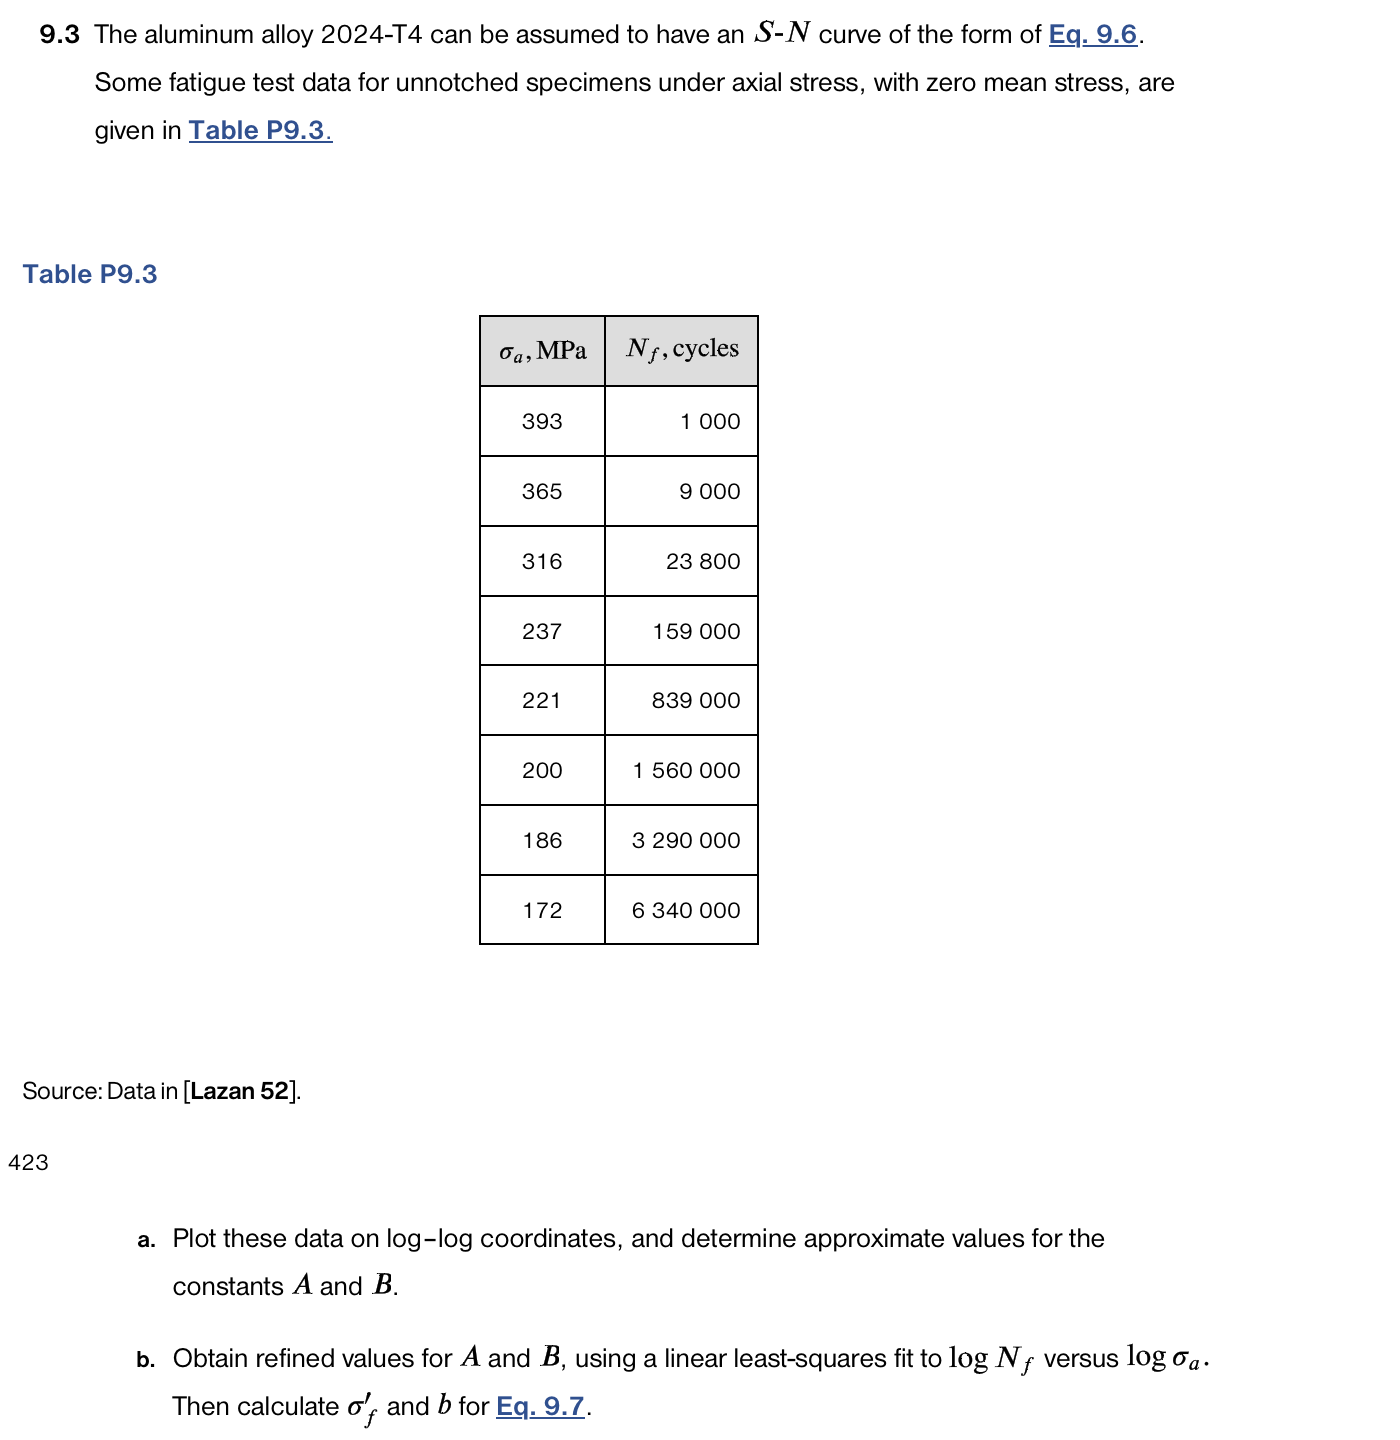
9.3 The aluminum alloy 2024-T4 can be assumed to have an S-N curve of the form of Eq. 9.6. Some fatigue test data for


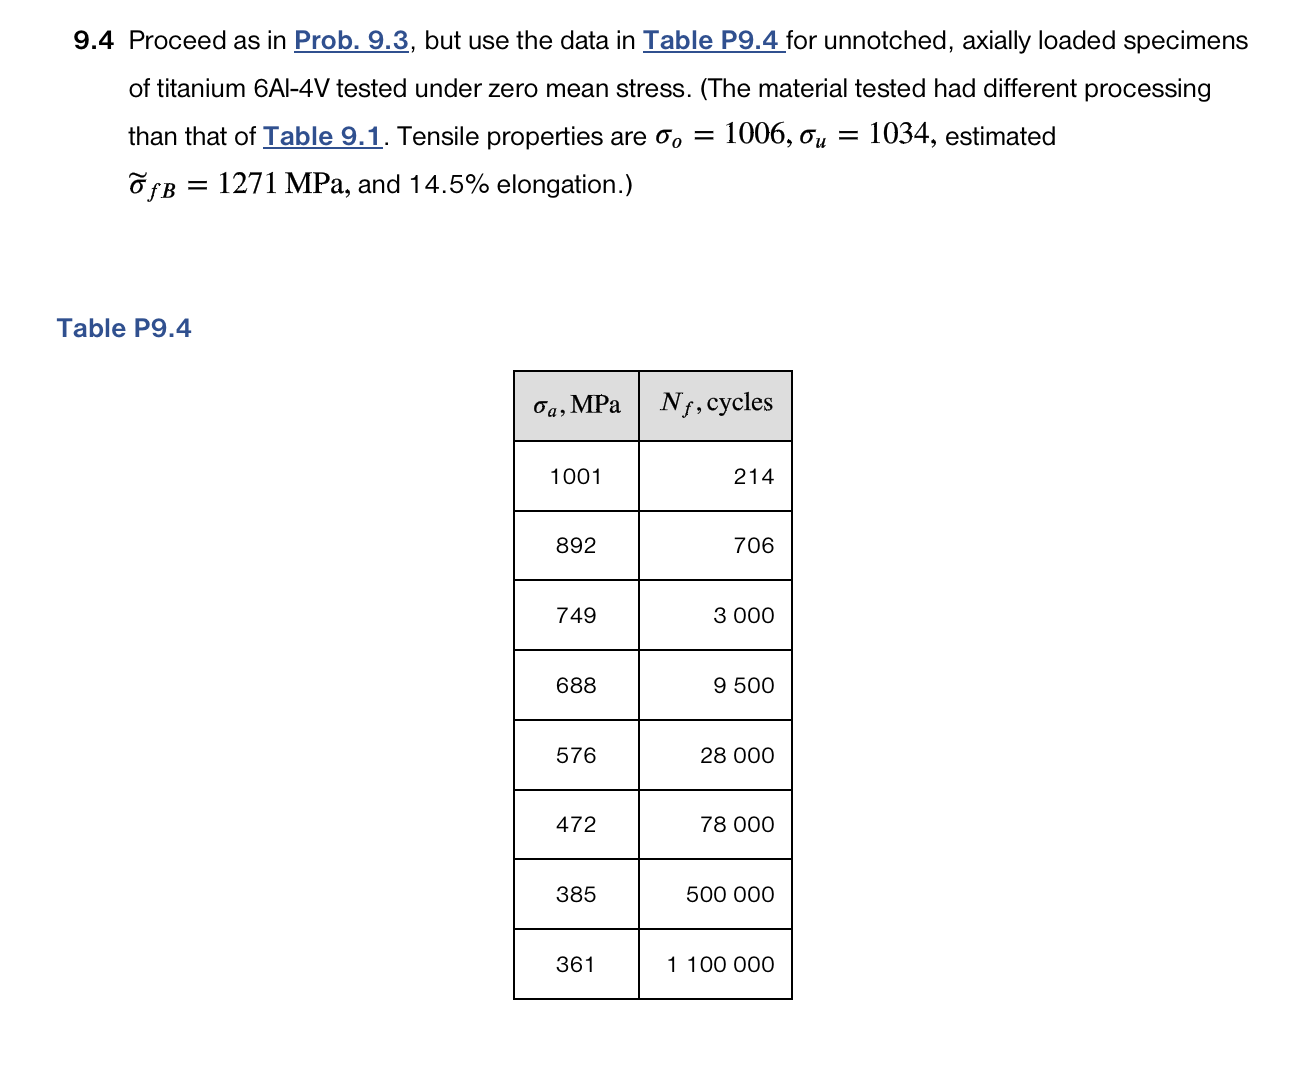
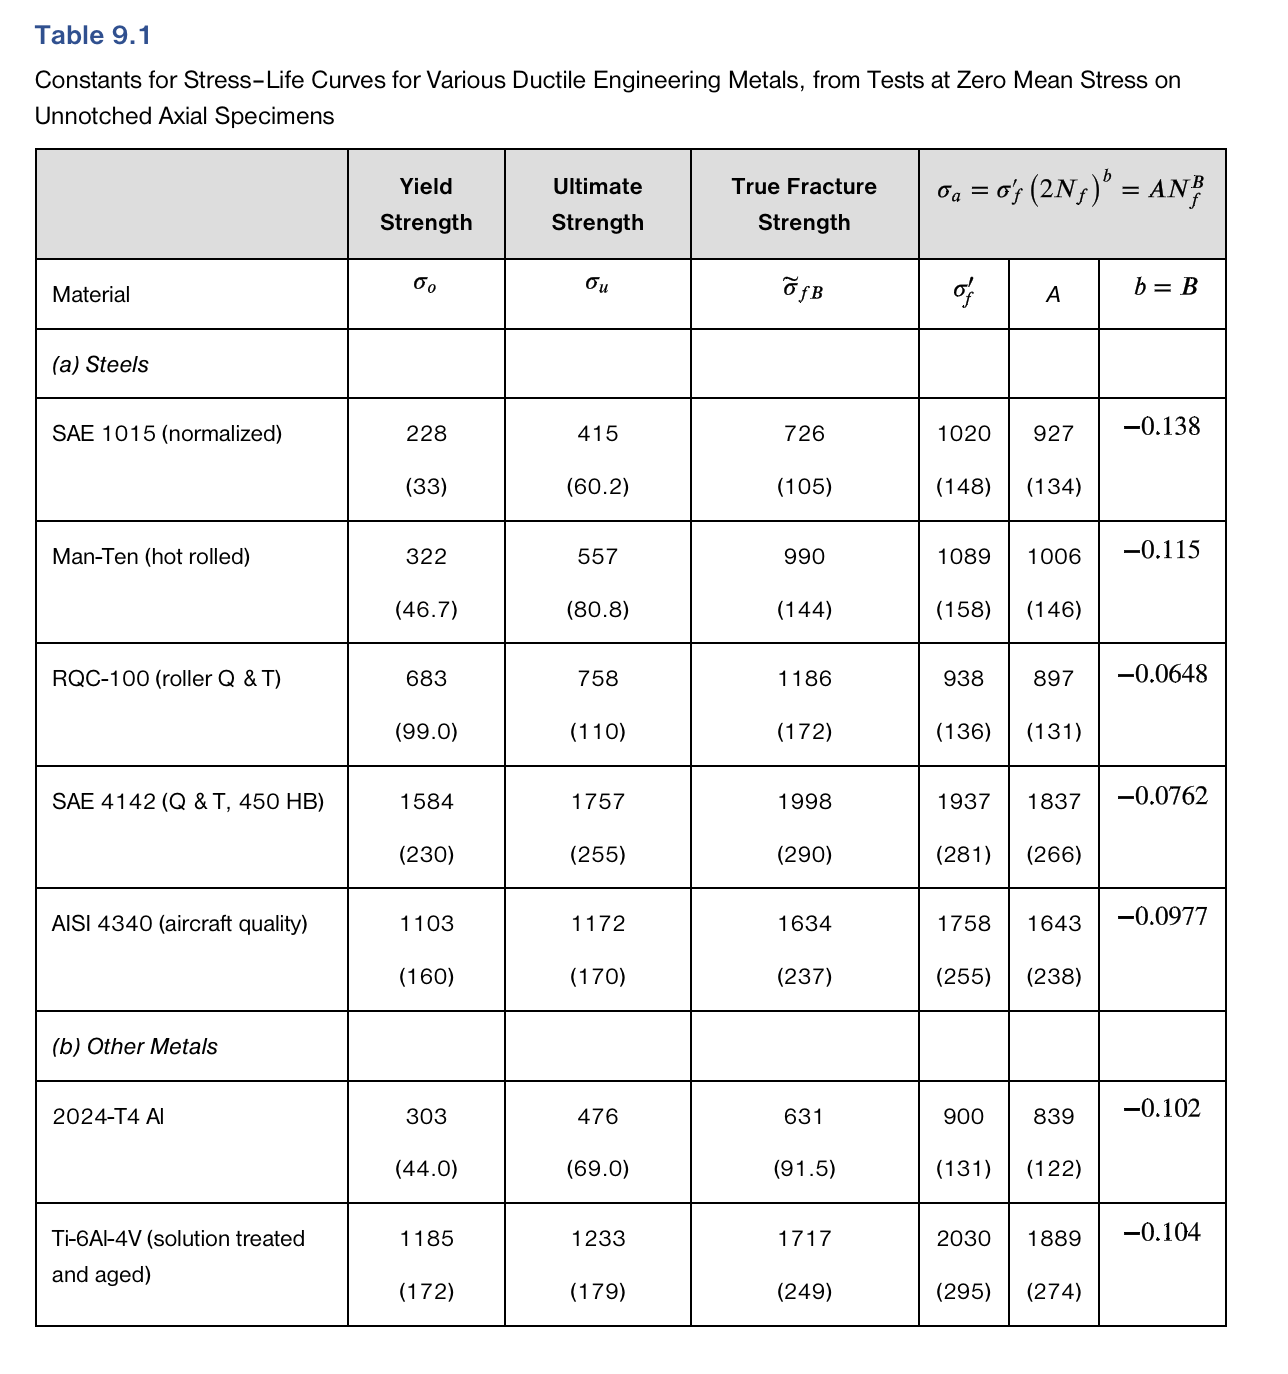
9.3 The aluminum alloy 2024-T4 can be assumed to have an S-N curve of the form of Eq. 9.6. Some fatigue test data for unnotched specimens under axial stress, with zero mean stress, are given in Table P9.3. Table P9.3 Source: Data in [Lazan 52]. 423 MPa Nf, cycles 393 365 316 237 221 200 186 172 1 000 9 000 23 800 159 000 839 000 1 560 000 3 290 000 6 340 000 a. Plot these data on log-log coordinates, and determine approximate values for the constants A and B. b. Obtain refined values for A and B, using a linear least-squares fit to log Ny versus logoa. Then calculate off and b for Eq. 9.7. 9.4 Proceed as in Prob. 9.3, but use the data in Table P9.4 for unnotched, axially loaded specimens of titanium 6Al-4V tested under zero mean stress. (The material tested had different processing than that of Table 9.1. Tensile properties are o 1006, ou = 1034, estimated of B = 1271 MPa, and 14.5% elongation.) Table P9.4 a, MPa 1001 892 749 688 576 472 385 361 Nf, cycles 214 706 3 000 9 500 28 000 78 000 500 000 1 100 000 = Table 9.1 Constants for Stress-Life Curves for Various Ductile Engineering Metals, from Tests at Zero Mean Stress on Unnotched Axial Specimens Material (a) Steels SAE 1015 (normalized) Man-Ten (hot rolled) RQC-100 (roller Q & T) SAE 4142 (Q & T, 450 HB) AISI 4340 (aircraft quality) (b) Other Metals 2024-T4 Al Ti-6Al-4V (solution treated and aged) Yield Strength %0 228 (33) 322 (46.7) 683 (99.0) 1584 (230) 1103 (160) 303 (44.0) 1185 (172) Ultimate Strength 415 (60.2) 557 (80.8) 758 (110) 1757 (255) 1172 (170) 476 (69.0) 1233 (179) True Fracture Strength ofB 726 (105) 990 (144) 1186 (172) 1998 (290) 1634 (237) 631 (91.5) 1717 (249) a = o' (2N) = AN of 1020 (148) A 1089 1006 1937 927 (158) (146) (281) (134) 938 897 -0.0648 (136) (131) 2030 1837 (266) 1758 (255) (238) 900 839 (131) (122) b = B 1643 -0.0977 1889 -0.138 (295) (274) -0.115 -0.0762 -0.102 -0.104
Step by Step Solution
There are 3 Steps involved in it
Step: 1

Get Instant Access to Expert-Tailored Solutions
See step-by-step solutions with expert insights and AI powered tools for academic success
Step: 2

Step: 3

Ace Your Homework with AI
Get the answers you need in no time with our AI-driven, step-by-step assistance
Get Started


