Answered step by step
Verified Expert Solution
Link Copied!

Question

1 Approved Answer

9/31 Question 2 of 7, Step 5 of 5 Correct The following bar graph shows the per capita personal incomes for six states in 2003.
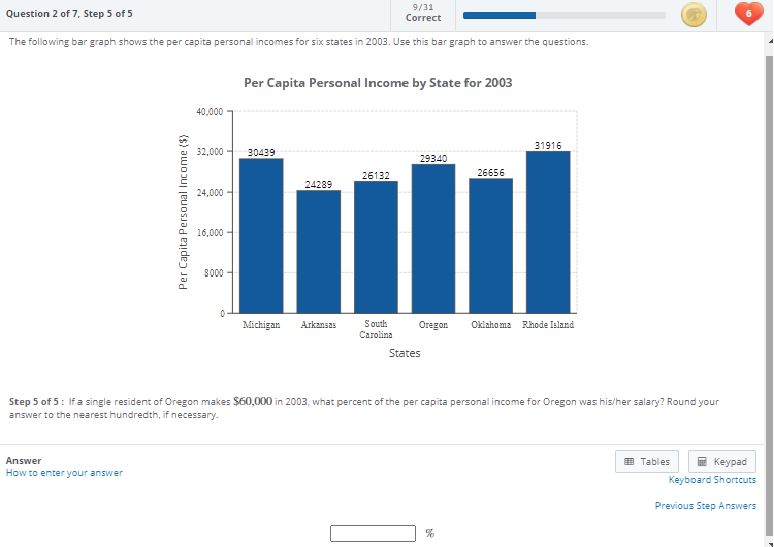
image text in transcribed
9/31 Question 2 of 7, Step 5 of 5 Correct The following bar graph shows the per capita personal incomes for six states in 2003. Use this bar graph to answer the questions. Per Capita Personal Income by State for 2003 401000 Per Capita Personal Income ($) 32,000 - 30439 31916 29340 24289 26132 26656 24,000 - 16,000 - 8000 - 0 - Michigan Arkansas South Carolina Oregon Oklahoma Rhode Island States Step 5 off 5: If a single resident of Oregon makes $60,000 in 2003, what percent of the per capita personal income for Oregon was his/her salary? Round your answer to the nearest hundredth, if necessary. Answer Tables Keypad How to enter your answer Keyboard Shortcuts Previous Step Answers

Step by Step Solution

There are 3 Steps involved in it

Step: 1

blur-text-image

Get Instant Access to Expert-Tailored Solutions

See step-by-step solutions with expert insights and AI powered tools for academic success

Step: 2

blur-text-image_2

Step: 3

blur-text-image_3

Ace Your Homework with AI

Get the answers you need in no time with our AI-driven, step-by-step assistance

Get Started

Recommended Textbook for

Making Hard Decisions with decision tools

Authors: Robert Clemen, Terence Reilly

3rd edition

538797576, 978-0538797573

More Books

Students also viewed these Mathematics questions