Answered step by step
Verified Expert Solution
Question
1 Approved Answer
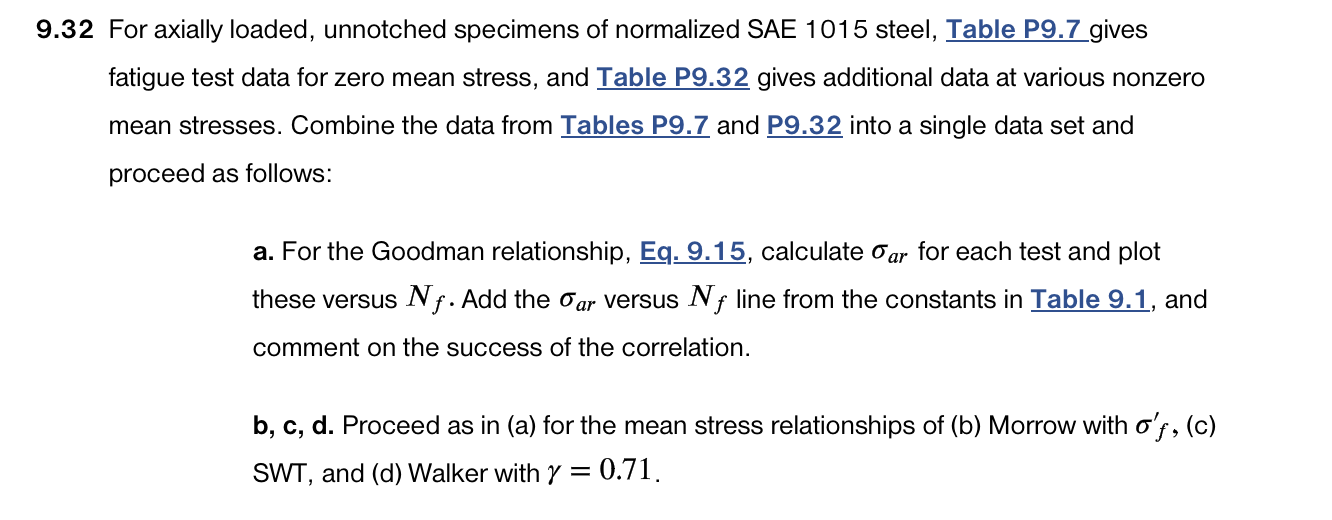
9.32 For axially loaded, unnotched specimens of normalized SAE 1015 steel, Table P9.7 gives fatigue test data for zero mean stress, and Table P9.32


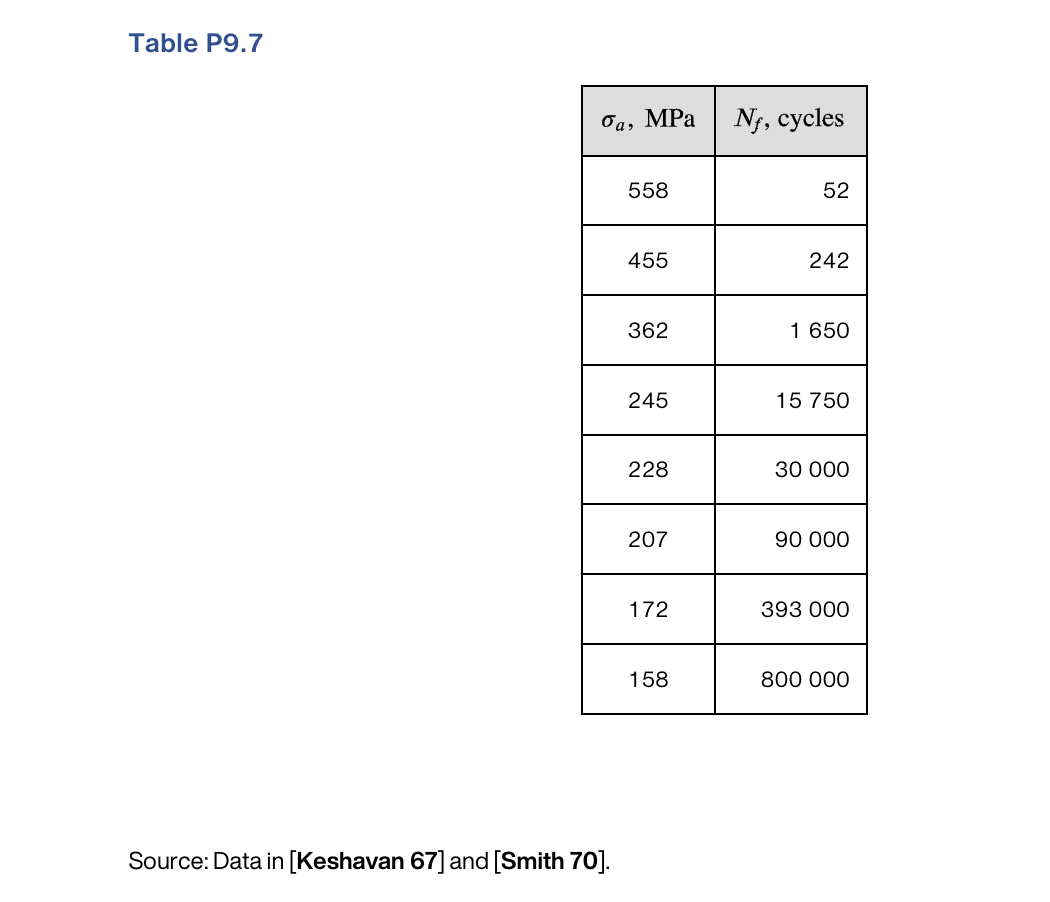
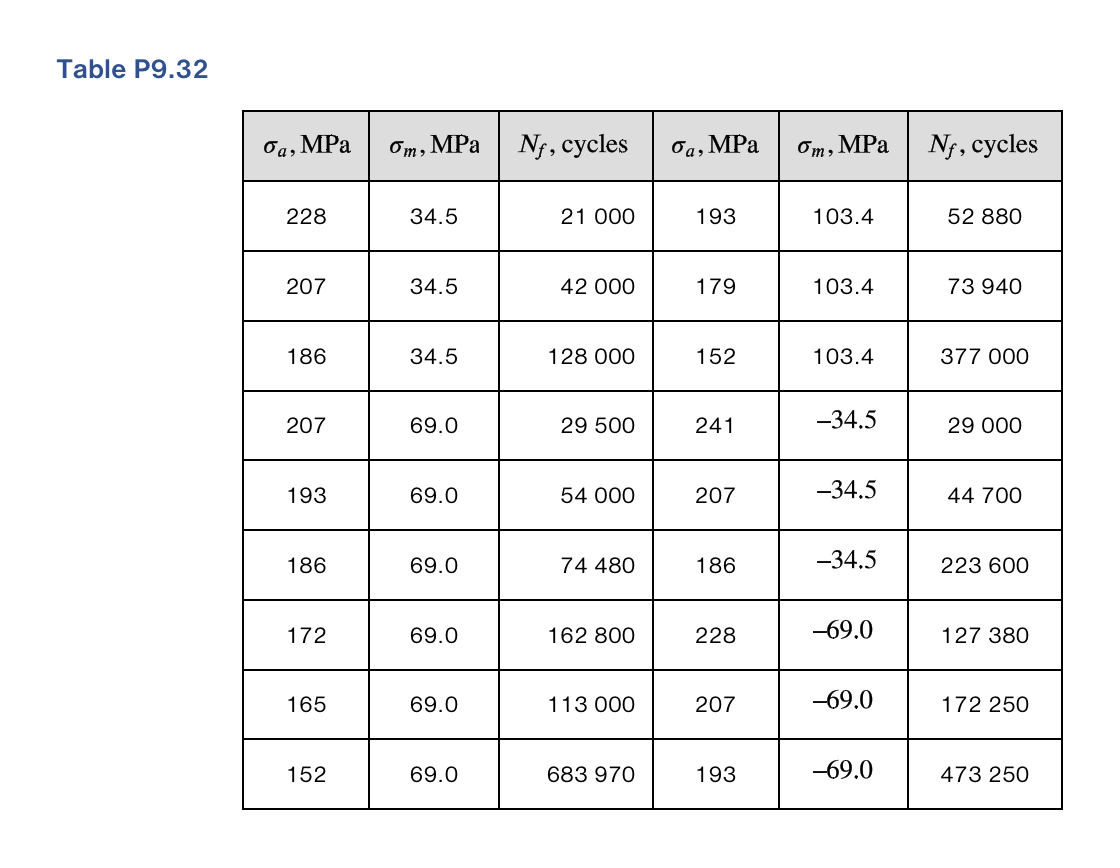
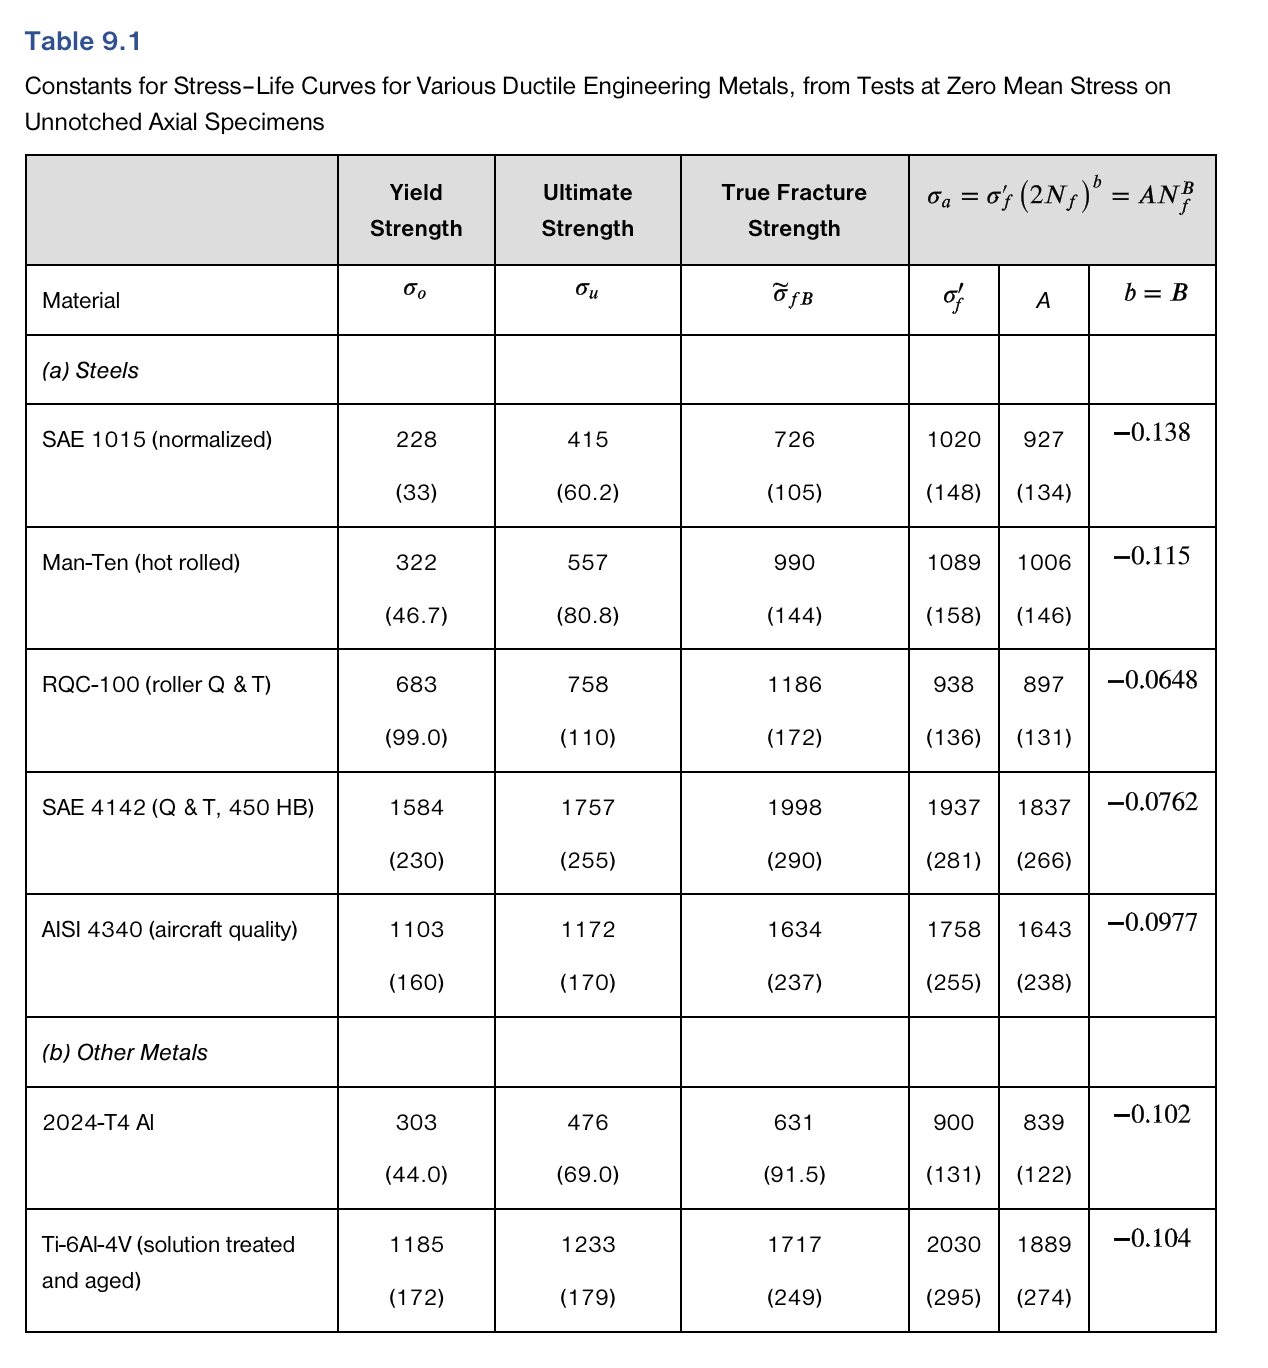
9.32 For axially loaded, unnotched specimens of normalized SAE 1015 steel, Table P9.7 gives fatigue test data for zero mean stress, and Table P9.32 gives additional data at various nonzero mean stresses. Combine the data from Tables P9.7 and P9.32 into a single data set and proceed as follows: a. For the Goodman relationship, Eq. 9.15, calculate ar for each test and plot these versus N. Add the ar versus N line from the constants in Table 9.1, and comment on the success of the correlation. b, c, d. Proceed as in (a) for the mean stress relationships of (b) Morrow with o'f, (c) SWT, and (d) Walker with y = 0.71. Table P9.7 Ja, MPa Source: Data in [Keshavan 67] and [Smith 70]. 558 455 362 245 228 207 172 158 Nf, cycles 52 242 1 650 15 750 30 000 90 000 393 000 800 000 Table P9.32 Ja, MPa 228 207 186 207 193 186 172 165 152 om, MPa 34.5 34.5 34.5 69.0 69.0 69.0 69.0 69.0 69.0 Nf, cycles 21 000 42 000 128 000 29 500 54 000 74 480 162 800 113 000 683 970 Ja, MPa 193 179 152 241 207 186 228 207 193 om, MPa 103.4 103.4 103.4 -34.5 -34.5 -34.5 -69.0 -69.0 -69.0 Nf, cycles 52 880 73 940 377 000 29 000 44 700 223 600 127 380 172 250 473 250 (9.15) o ar + Om = 1 Table 9.1 Constants for Stress-Life Curves for Various Ductile Engineering Metals, from Tests at Zero Mean Stress on Unnotched Axial Specimens Material (a) Steels SAE 1015 (normalized) Man-Ten (hot rolled) RQC-100 (roller Q & T) SAE 4142 (Q & T, 450 HB) AISI 4340 (aircraft quality) (b) Other Metals 2024-T4 Al Ti-6AI-4V (solution treated and aged) Yield Strength 228 (33) 322 (46.7) 683 (99.0) 1584 (230) 1103 (160) 303 (44.0) 1185 (172) Ultimate Strength 415 (60.2) 557 (80.8) 758 (110) 1757 (255) 1172 (170) 476 (69.0) 1233 (179) True Fracture Strength of B 726 (105) 990 (144) 1186 (172) 1998 (290) 1634 (237) 631 (91.5) 1717 (249) a = o' (2N) = ANB of A 1020 927 (148) (134) 1089 (158) 938 1006 (136) (131) 1758 (146) 1937 1837 (281) (266) 900 897 -0.0648 (255) (238) (295) 1643 839 (131) (122) 2030 1889 b = B (274) -0.138 -0.115 -0.0762 -0.0977 -0.102 -0.104
Step by Step Solution
There are 3 Steps involved in it
Step: 1

Get Instant Access to Expert-Tailored Solutions
See step-by-step solutions with expert insights and AI powered tools for academic success
Step: 2

Step: 3

Ace Your Homework with AI
Get the answers you need in no time with our AI-driven, step-by-step assistance
Get Started


