Answered step by step
Verified Expert Solution
Link Copied!

Question

1 Approved Answer

a 2. For a time series {Xt} with sample size 100, the sample autocorrelation function (ACF) and sample partial autocorrelation function (PACF) for {Xt} and
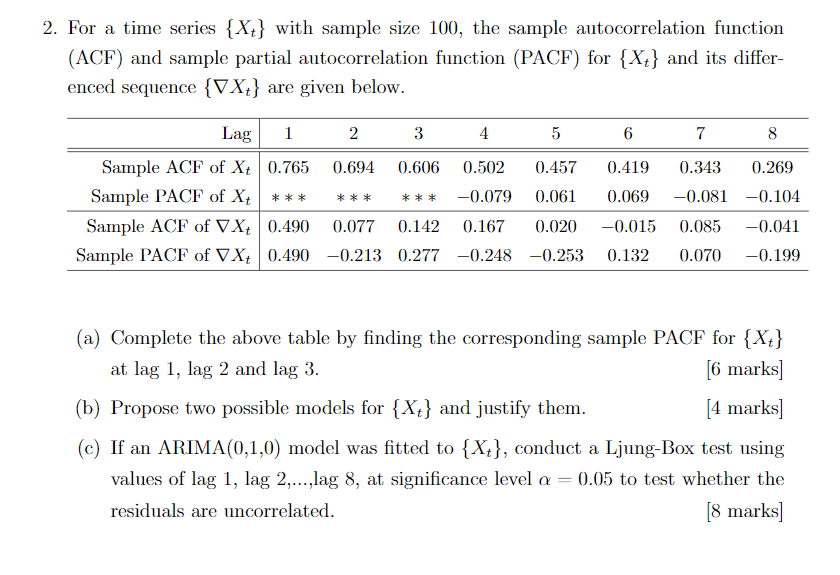
image text in transcribed

a 2. For a time series {Xt} with sample size 100, the sample autocorrelation function (ACF) and sample partial autocorrelation function (PACF) for {Xt} and its differ- enced sequence {VXt} are given below. 6 7 8 0.419 0.343 0.269 Lag 1 2 3 4 5 Sample ACF of Xt 0.765 0.694 0.606 0.502 0.457 Sample PACF of Xt -0.079 0.061 Sample ACF of VX+ 0.490 0.077 0.142 0.167 0.020 Sample PACF of VX4 0.490 -0.213 0.277 -0.248 -0.253 *** *** *** 0.069 -0.081 -0.104 -0.015 0.085 -0.041 0.132 0.070 -0.199 (a) Complete the above table by finding the corresponding sample PACF for {Xt} at lag 1, lag 2 and lag 3. [6 marks] (b) Propose two possible models for {Xt} and justify them. [4 marks] (C) If an ARIMA(0,1,0) model was fitted to {Xt}, conduct a Ljung-Box test using values of lag 1, lag 2,...,lag 8, at significance level a = 0.05 to test whether the , residuals are uncorrelated. [8 marks) a 2. For a time series {Xt} with sample size 100, the sample autocorrelation function (ACF) and sample partial autocorrelation function (PACF) for {Xt} and its differ- enced sequence {VXt} are given below. 6 7 8 0.419 0.343 0.269 Lag 1 2 3 4 5 Sample ACF of Xt 0.765 0.694 0.606 0.502 0.457 Sample PACF of Xt -0.079 0.061 Sample ACF of VX+ 0.490 0.077 0.142 0.167 0.020 Sample PACF of VX4 0.490 -0.213 0.277 -0.248 -0.253 *** *** *** 0.069 -0.081 -0.104 -0.015 0.085 -0.041 0.132 0.070 -0.199 (a) Complete the above table by finding the corresponding sample PACF for {Xt} at lag 1, lag 2 and lag 3. [6 marks] (b) Propose two possible models for {Xt} and justify them. [4 marks] (C) If an ARIMA(0,1,0) model was fitted to {Xt}, conduct a Ljung-Box test using values of lag 1, lag 2,...,lag 8, at significance level a = 0.05 to test whether the , residuals are uncorrelated. [8 marks)

Step by Step Solution

There are 3 Steps involved in it

Step: 1

blur-text-image

Get Instant Access to Expert-Tailored Solutions

See step-by-step solutions with expert insights and AI powered tools for academic success

Step: 2

blur-text-image

Step: 3

blur-text-image

Ace Your Homework with AI

Get the answers you need in no time with our AI-driven, step-by-step assistance

Get Started

Recommended Textbook for

More Books

Students also viewed these Finance questions

Question

Choose the best chart for your dataset.

Answered: 1 week ago