Question
(a) A manufacturing engineer is testing a power supply used for machine A. Based on 250 testings, the complete table of observed frequencies are

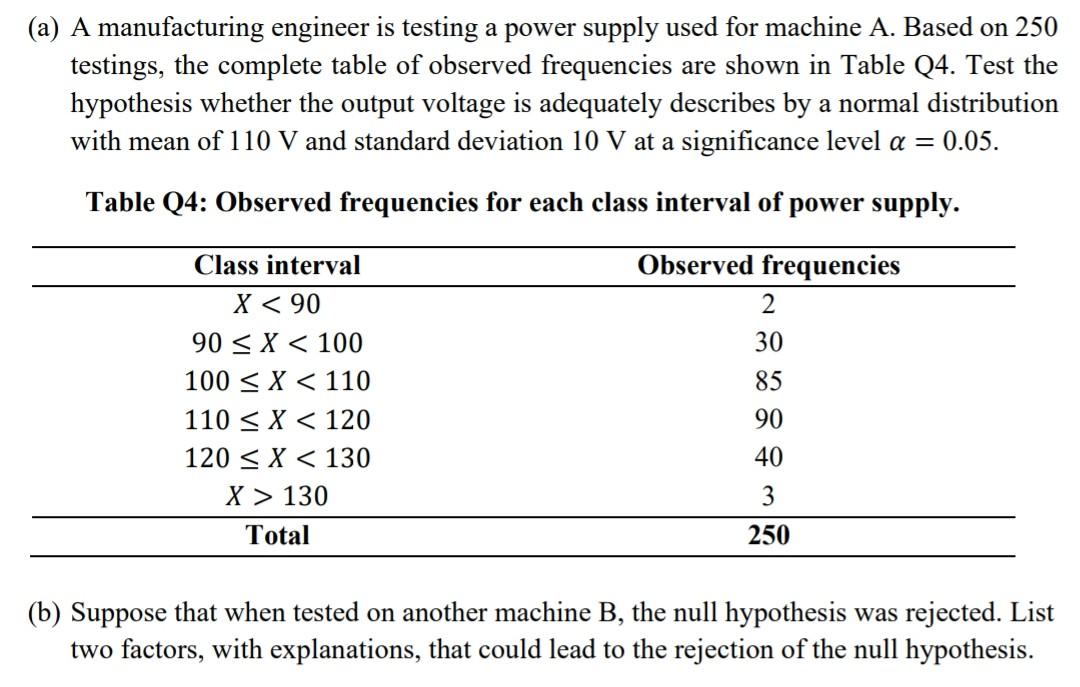
(a) A manufacturing engineer is testing a power supply used for machine A. Based on 250 testings, the complete table of observed frequencies are shown in Table Q4. Test the hypothesis whether the output voltage is adequately describes by a normal distribution with mean of 110 V and standard deviation 10 V at a significance level a = 0.05. Table Q4: Observed frequencies for each class interval of power supply. Observed frequencies Class interval X < 90 90 X 100 100 X 110 110 < X < 120 120 < X < 130 X > 130 Total 2 30 85 90 40 3 250 (b) Suppose that when tested on another machine B, the null hypothesis was rejected. List two factors, with explanations, that could lead to the rejection of the null hypothesis.
Step by Step Solution
3.43 Rating (169 Votes )
There are 3 Steps involved in it
Step: 1
O Find the no 74 Trans form of ...
Get Instant Access to Expert-Tailored Solutions
See step-by-step solutions with expert insights and AI powered tools for academic success
Step: 2

Step: 3

Ace Your Homework with AI
Get the answers you need in no time with our AI-driven, step-by-step assistance
Get StartedRecommended Textbook for
Statistical Inference
Authors: George Casella, Roger L. Berger
2nd edition
0534243126, 978-0534243128
Students also viewed these Mathematics questions
Question
Answered: 1 week ago
Question
Answered: 1 week ago
Question
Answered: 1 week ago
Question
Answered: 1 week ago
Question
Answered: 1 week ago
Question
Answered: 1 week ago
Question
Answered: 1 week ago
Question
Answered: 1 week ago
Question
Answered: 1 week ago
Question
Answered: 1 week ago
Question
Answered: 1 week ago
Question
Answered: 1 week ago
Question
Answered: 1 week ago
Question
Answered: 1 week ago
Question
Answered: 1 week ago
Question
Answered: 1 week ago
Question
Answered: 1 week ago
Question
Answered: 1 week ago
Question
Answered: 1 week ago
Question
Answered: 1 week ago
Question
Answered: 1 week ago
Question
Answered: 1 week ago
View Answer in SolutionInn App


