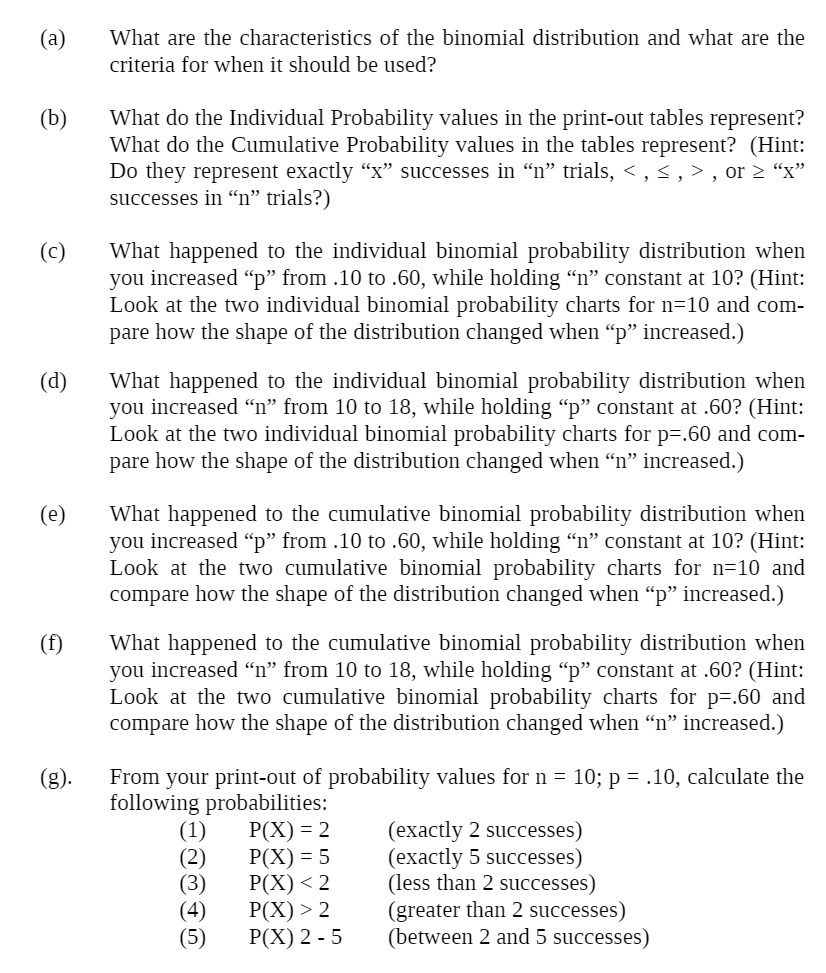
(a) (b) (C) (d) (E) (f) (8)- What are the characteristics of the binomial distribution and what are the criteria for when it should be used? What do the Individual Probability values in the print-out tables represent? What do the Cumulative Probability values in the tables represent? (Hint: Do they represent exactly \"it\" successes in \"11\" trials, , or a \"x\" J J successes in \"11\" trials?) What happened to the individual binomial probability distribution when you increased \"p\" from .10 to .60, while holding \"n\" constant at 10? (Hint: Look at the two individual binomial probability charts for n=10 and com- pare how the shape of the distribution changed when \"p\" increased.) What happened to the individual binomial probability distribution when you increased \"11\" from 10 to 18, while holding \"p\" constant at .60? (Hint: Look at the two individual binomial probability charts for p=.60 and com- pare how the shape of the distribution changed when \"11\" increased.) What happened to the cumulative binomial probability distribution when you increased \"p\" from .10 to .60, while holding \"n\" constant at 10? (Hint: Look at the two cumulative binomial probability charts for n=10 and compare how the shape of the distribution changed when \"p\" increased.) What happened to the crunulaiive binomial probability distribution when you increased \"11\" from 10 to 18, while holding \"p\" constant at .60? (Hint: Look at the two cumulative binomial probability charts for p=.60 and compare how the shape of the distribution changed when \"11\" increased.) From your print-out of probability values for n : 10; p : .10, calculate the following probabilin'es: (1) P(X) : 2 (exactly 2 successes) (2) P(X) = 5 (exactly 5 successes) (3) P(X)