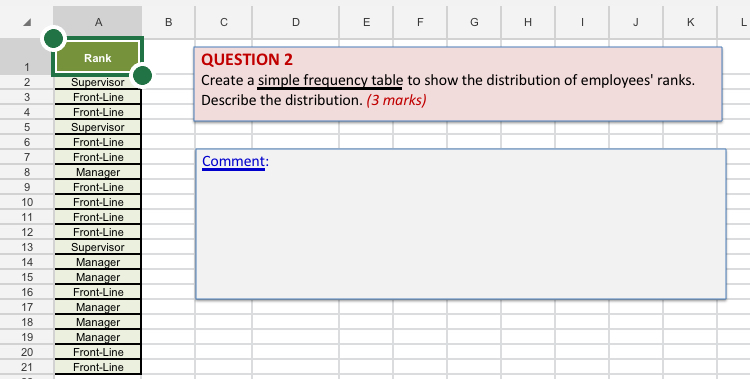
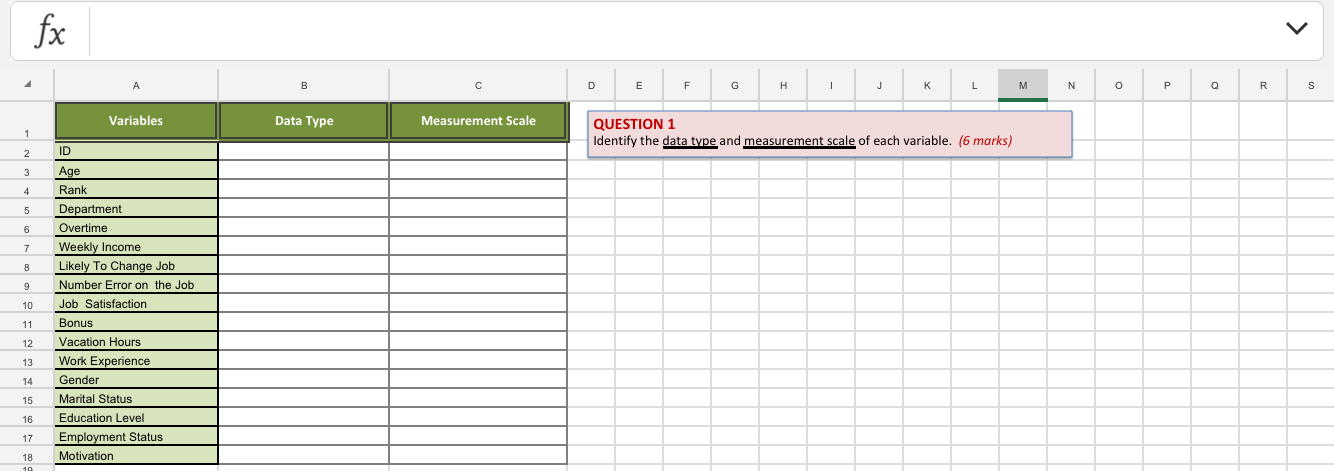
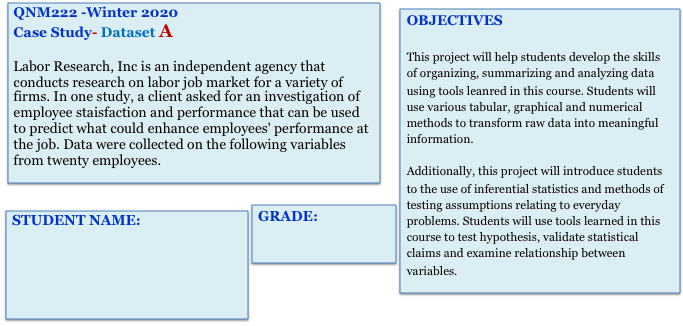
A B C D E F G H K L Rank QUESTION 2 Supervisor Create a simple frequency table to show the distribution of employees' ranks. Front-Line 4 Front-Line Describe the distribution. (3 marks) 5 Supervisor 6 Front-Line 7 Front-Line 8 Manager Comment: 9 Front-Line 10 Front-Line 11 Front-Line 12 Front-Line 13 Supervisor 14 Manager 15 Manager 16 Front-Line 17 Manager 18 Manager 19 Manager 20 Front-Line 21 Front-Linefx V A B C D E F G H K M O P R S Variables Data Type Measurement Scale QUESTION 1 ID Identify the data type and measurement scale of each variable. (6 marks) 3 Age Rank 5 Department Overtime 7 Weekly Income Likely To Change Job Number Error on the Job 10 Job Satisfaction 11 Bonus 12 Vacation Hours 13 Work Experience 14 Gender 15 Marital Status 16 Education Level 17 Employment Status 18 MotivationCoverpage Data Question 1 Question 2 Question 3 Question 4 Question 5 Question 6 Question 7 Question 8 Question 9 Question 10 Age Rank Department Overtime Weekly Likely To Change Number of Error Income Vacation Job on the Jobs Job Satisfaction Bonus Years of Work Marital Hours Experience Gender Status Education Level Employment 32 Status Motivation Front-Line Maintenance Occasion 560 Least Likely 31 Supervisor 5 High Administration 62 245 17 Female single Pre-High School Part-Time Salary 32 Never BOO Most Likely Manager 14 Low Maintenance 94 Rarely 44 1200 Manager Fairly Likely 200 115 18 Female Married High School Full-Time Vacation Production 20 Average 204 Docasion 890 Not At All 25 13 Female High 99 13 Married 160 College/University Part-Time Work Hours 43 47 Manager Production Frequently 1450 Front-Line east Likely Production Occasion 20 204 600 Least Likely 30 High 150 13 Female Single Post Graduate Full-Time 50 16 Female Promotion High 220 Married College/University 44 Front-Line Maintenance Frequently 750 Most Likely 26 Low 84 Female Full-Time Vacation Married Front-Line Production Frequently 780 Most Likely Low 110 11 High School Part-Time Salary 13 Female Married High School Part-Time Salary Front-Line Maintenance Frequenth 600 Female Widow High School Part-Time Salar Front-Line Least Likely Production Frequently 440 Low Least Likely Low Female Married Pre-High School Female Part-Time Salary Front-Line Production Frequently 400 Fairly Likely Low Widow Pre-High School Female Full-Time Work Hours Front-Line Production Occasion 700 re-High School 800 Fairly Likely Low Divorce Front-Line Fairly Likely Production Never Average Female Full-Time Married Work Hours High School Full-Time Work Hours Front-Line Production Occasion 60 Male Married College/University Front-Line Fairly Likely Occasion 1000 Male Part-Time Work Hours Production Fairly Likely Married College/Universit Part-Time Promotion Front-Line Maintenance Rarely Supervisor 790 Fairly Likely Administration Never 800 Least Likely High 100 82 Male Married Male Pre-High School Part-Time Promotion Married High School Part-Time Promotion Supervisor Maintenance Rarely 975 Low 1200 100 Male Married Supervisor Least Likely Maintenance Low High School Occasion Male Part-Time Promotion Single High School Part-Time Promotion Front-Ling Fairly Likely Maintenance High Never 1200 Fairly Likely High 115 115 Male Married Collage/University Part-Time Female Work Hours Single High School Full-Time VacationQNM222 -Winter 2020 Case Study- Dataset A OBJECTIVES Labor Research, Inc is an independent agency that This project will help students develop the skills conducts research on labor job market for a variety of of organizing, summarizing and analyzing data firms. In one study, a client asked for an investigation of using tools leanred in this course. Students will employee staisfaction and performance that can be used use various tabular, graphical and numerical to predict what could enhance employees' performance at methods to transform raw data into meaningful the job. Data were collected on the following variables information. from twenty employees. Additionally, this project will introduce students to the use of inferential statistics and methods of testing assumptions relating to everyday STUDENT NAME: GRADE: problems. Students will use tools learned in this course to test hypothesis, validate statistical claims and examine relationship between variables


