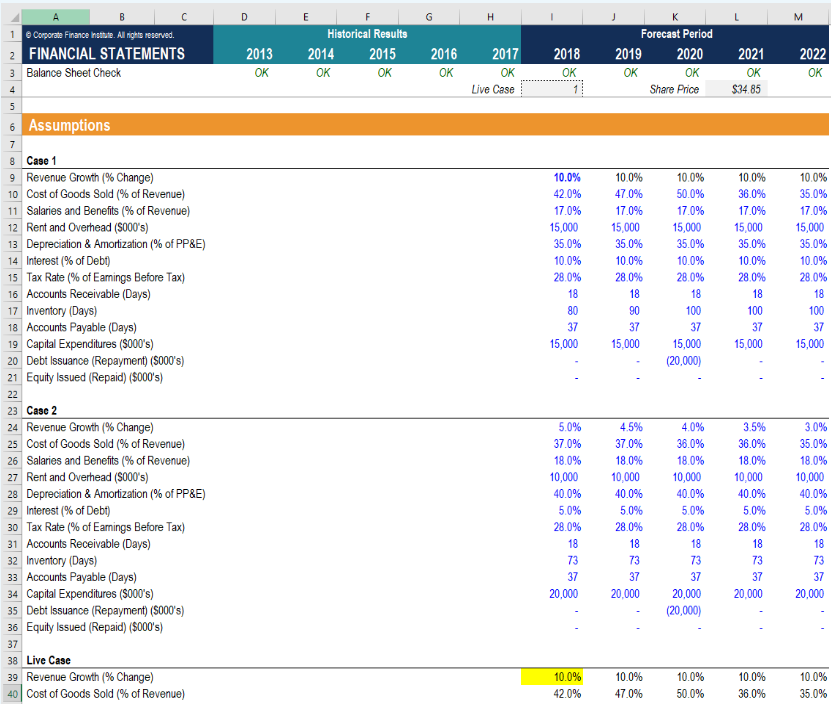
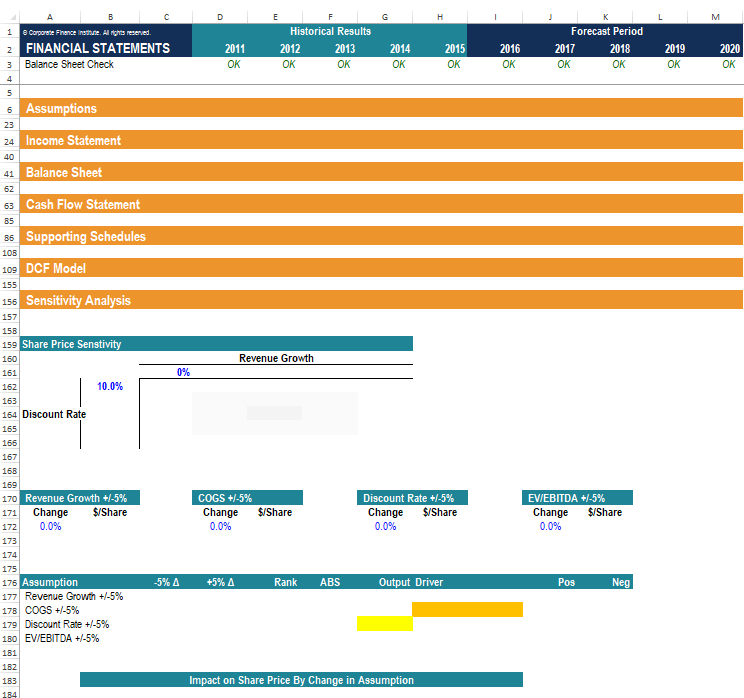
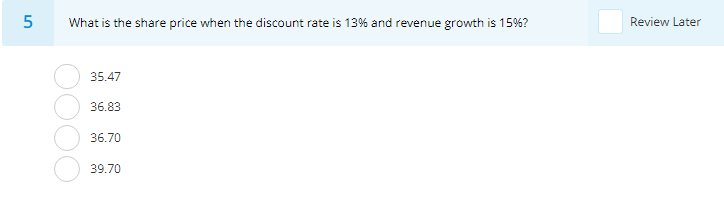
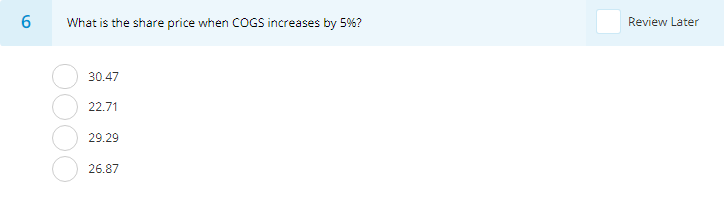
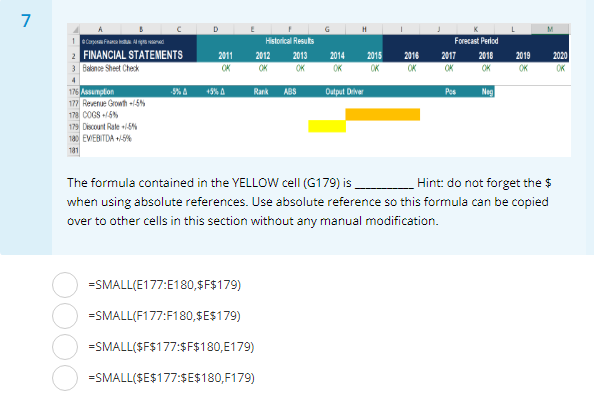
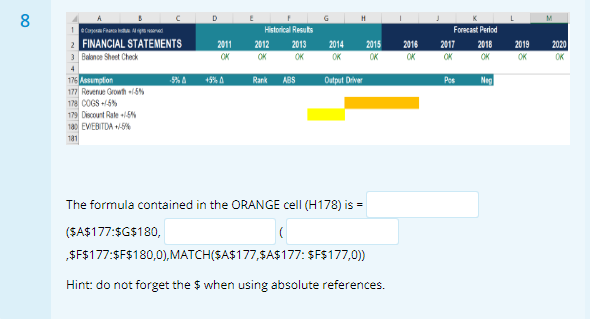
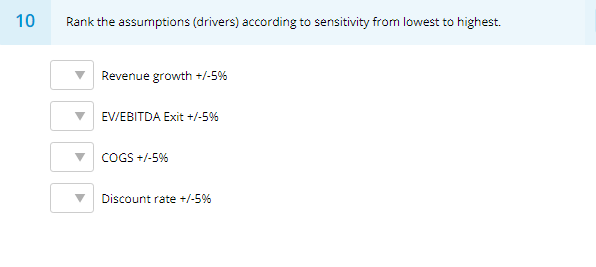
A B C D E F H K M Historical Results Forecast Period 9 Coporate Finance Instute. All rights reserved. FINANCIAL STATEMENTS 2013 2014 2015 2016 2017 2018 2019 2020 2021 2022 2 OK OK Balance Sheet Check OK OK OK OK OK OK OK OK Live Case $34 85 1 Share Price 4. 5 Assumptions 7 8 Case 1 Revenue Growth (% Change ) 10.0% 10.0% 10.0% 10.0% 10.0% 9 Cost of Goods Sold (% of Revenue) 42,0% 47.0% 50.0% 36.0% 35,0% 10 11 Salaries and Benefits (% of Revenue) 12 Rent and Overhead (S000's) 17.0% 17.0% 17.0% 17.0% 17.0% 15,000 15,000 15,000 15,000 15,000 13 Depreciation & Amortization (% of PP&E) 35,0% 35.0% 35.0% 35.0% 35,0% 14 Interest (% of Deb) 15 Tax Rate (% of Eamings Before Tax) 16 Accounts Receivable (Days) 17 Inventory (Days) 18 Accounts Payable (Days) 19 Capital Expenditures (S000's) 20 Debt Issuance (Repayment) (S000's) 21 Equity Issued (Repaid) ($000's) 10.0% 10.0% 10.0% 10.0% 10.0% 28.0% 28.0% 28.0% 28.0% 28.0% 18 18 18 18 18 100 80 90 100 100 37 37 37 37 37 15,000 15,000 15,000 15,000 15,000 (20,000) 22 23 Case 2 24 Revenue Growth (% Change ) 25 Cost of Goods Sold (% of Revenue) 5.0% 4.5% 4.0% 3.5% 3.0% 37.0% 37.0% 36.0% 36.0% 35.0% 18.0% 18.0% 18.0% 18.0% 18.0% 26 Salaries and Benefits (% of Revenue) 27 Rent and Overhead (S000's) 10,000 10.000 10,000 10,000 10,000 Depreciation & Amortization (% of PP&E) 40,0% 40.0% 40,0% 40.0% 40.0% 28 Interest (% of Debt) Tax Rate (% of Eamings Before Tax) Accounts Receivable (Days) 5.0% 5.0% 5.0% 5.0% 5.0% 29 28.0 % 28.0% 28.0% 28.0% 28.0% 30 18 18 18 18 18 31 32 Inventory (Days) 33 Accounts Payable (Days) 34 Capital Expenditures ($000's) 35 Debt Issuance (Repayment) (S000's) 36 Equity Issued (Repaid) (S000's) 73 73 73 73 73 37 37 37 37 37 20,000 20,000 20,000 20,000 20,000 (20,000) 3. 38 Live Case 39 Revenue Growth (% Change ) 40 Cost of Goods Sold (% of Revenue) 10.0% 10.0% 10.0% 10.0% 10.0% 42.0% 47.0% 50.0% 36.0% 35.0% C D F E H M Historical Results Forecast Period Carparete Finence Insthute. All rights reserved. FINANCIAL STATEMENTS 2018 2011 2012 2013 2014 2015 2016 2017 2019 2020 Balance Sheet Check OK OK OK OK OK OK OK OK OK OK 4 Assumptions 23 Income Statement 24 40 Balance Sheet 41 62 Cash Flow Statement 63 85 Supporting Schedules 86 108 109 DCF Model 155 Sensitivity Analysis 156 157 158 159 Share Price Senstivity Revenue Growth 160 0% 161 10.0 % 162 163 164 Discount Rate 165 166 167 168 169 170 Revenue Growth +/-5% Change COGS +/-5% Discount Rate+/-5% Change 0.0 % EVIEBITDA +5% $/Share $/Share $/Share $/Share Change Change 0.0 % 171 0.0% 0.0% 172 173 174 175 176 Assumption 177 Revenue Growth +/-5 % 178 COGS /-5 % 179 Discount Rate +/-5% 180 EV/EBITDA +/-5% 5%A +5% A Rank ABS Output Driver Pos Neg 181 182 Impact on Share Price By Change in Assumption 183 184 5 Review Later What is the share price when the discount rate is 13% and revenue growth is 15%? 35.47 36.83 36.70 39.70 6 What is the share price when COGS increases by 5 %? Review Later 30.47 22.71 29.29 26.87 7 D G M H Historical Resubs Forecast Period 2 FINANCIAL STATEMENTS 2011 2012 2013 2014 2015 2016 2017 2018 2019 2020 3 Baanoe Sheet Check OK OK OK OK OK 176 Assumplion 177 Revenue Growth -15% 178 COGS5% 179 Discount Rale 15% a EVEBITDA 5% -5% A +5%A Rank ABS Oatput Driver Pos Neg 181 The formula contained in the YELLOW cell (G179) is Hint: do not forget the $ when using absolute references. Use absolute reference so this formula can be copied over to other cells in this section without any manual modification =SMALL(E177:E180,$ F$179) SMALL(F177:F180,$ES179) -SMALL($F$177:$F$180,E179) =SMALL(SE$177:$E$180,F179) C G M H Historical Resubs Forecast Period CaFea l h 2 FINANCIAL STATEMENTS 3 Baknoe Sheet Check 2012 2011 2013 2014 2015 2016 2017 2018 2019 2020 OK OK OK OK OK OK OK OK OK 4 176 Assumption 177 Revenue Growth 15% 17 COGS+5 179 Discount Rate 5% a EVEBITDA 5% +5% A Rank ABS Pos Oatput Driver Neg 1a1 The formula contained in the ORANGE cell (H178) is (SA$177:$G$180, $F$177:$F$180,0),MATCH (SA$177,SA$177: SF$177,0)) Hint: do not forget the $ when using absolute references. What type of chart did we use to build a tornado chart? Tornado chart Column chart Clustered bar chart Stacked bar chart 10 Rank the assumptions (drivers) according to sensitivity from lowest to highest. Revenue growth +/-59% EV/EBITDA Exit +/-5% COGS +-5% Discount rate +/-5% A B C D E F H K M Historical Results Forecast Period 9 Coporate Finance Instute. All rights reserved. FINANCIAL STATEMENTS 2013 2014 2015 2016 2017 2018 2019 2020 2021 2022 2 OK OK Balance Sheet Check OK OK OK OK OK OK OK OK Live Case $34 85 1 Share Price 4. 5 Assumptions 7 8 Case 1 Revenue Growth (% Change ) 10.0% 10.0% 10.0% 10.0% 10.0% 9 Cost of Goods Sold (% of Revenue) 42,0% 47.0% 50.0% 36.0% 35,0% 10 11 Salaries and Benefits (% of Revenue) 12 Rent and Overhead (S000's) 17.0% 17.0% 17.0% 17.0% 17.0% 15,000 15,000 15,000 15,000 15,000 13 Depreciation & Amortization (% of PP&E) 35,0% 35.0% 35.0% 35.0% 35,0% 14 Interest (% of Deb) 15 Tax Rate (% of Eamings Before Tax) 16 Accounts Receivable (Days) 17 Inventory (Days) 18 Accounts Payable (Days) 19 Capital Expenditures (S000's) 20 Debt Issuance (Repayment) (S000's) 21 Equity Issued (Repaid) ($000's) 10.0% 10.0% 10.0% 10.0% 10.0% 28.0% 28.0% 28.0% 28.0% 28.0% 18 18 18 18 18 100 80 90 100 100 37 37 37 37 37 15,000 15,000 15,000 15,000 15,000 (20,000) 22 23 Case 2 24 Revenue Growth (% Change ) 25 Cost of Goods Sold (% of Revenue) 5.0% 4.5% 4.0% 3.5% 3.0% 37.0% 37.0% 36.0% 36.0% 35.0% 18.0% 18.0% 18.0% 18.0% 18.0% 26 Salaries and Benefits (% of Revenue) 27 Rent and Overhead (S000's) 10,000 10.000 10,000 10,000 10,000 Depreciation & Amortization (% of PP&E) 40,0% 40.0% 40,0% 40.0% 40.0% 28 Interest (% of Debt) Tax Rate (% of Eamings Before Tax) Accounts Receivable (Days) 5.0% 5.0% 5.0% 5.0% 5.0% 29 28.0 % 28.0% 28.0% 28.0% 28.0% 30 18 18 18 18 18 31 32 Inventory (Days) 33 Accounts Payable (Days) 34 Capital Expenditures ($000's) 35 Debt Issuance (Repayment) (S000's) 36 Equity Issued (Repaid) (S000's) 73 73 73 73 73 37 37 37 37 37 20,000 20,000 20,000 20,000 20,000 (20,000) 3. 38 Live Case 39 Revenue Growth (% Change ) 40 Cost of Goods Sold (% of Revenue) 10.0% 10.0% 10.0% 10.0% 10.0% 42.0% 47.0% 50.0% 36.0% 35.0% C D F E H M Historical Results Forecast Period Carparete Finence Insthute. All rights reserved. FINANCIAL STATEMENTS 2018 2011 2012 2013 2014 2015 2016 2017 2019 2020 Balance Sheet Check OK OK OK OK OK OK OK OK OK OK 4 Assumptions 23 Income Statement 24 40 Balance Sheet 41 62 Cash Flow Statement 63 85 Supporting Schedules 86 108 109 DCF Model 155 Sensitivity Analysis 156 157 158 159 Share Price Senstivity Revenue Growth 160 0% 161 10.0 % 162 163 164 Discount Rate 165 166 167 168 169 170 Revenue Growth +/-5% Change COGS +/-5% Discount Rate+/-5% Change 0.0 % EVIEBITDA +5% $/Share $/Share $/Share $/Share Change Change 0.0 % 171 0.0% 0.0% 172 173 174 175 176 Assumption 177 Revenue Growth +/-5 % 178 COGS /-5 % 179 Discount Rate +/-5% 180 EV/EBITDA +/-5% 5%A +5% A Rank ABS Output Driver Pos Neg 181 182 Impact on Share Price By Change in Assumption 183 184 5 Review Later What is the share price when the discount rate is 13% and revenue growth is 15%? 35.47 36.83 36.70 39.70 6 What is the share price when COGS increases by 5 %? Review Later 30.47 22.71 29.29 26.87 7 D G M H Historical Resubs Forecast Period 2 FINANCIAL STATEMENTS 2011 2012 2013 2014 2015 2016 2017 2018 2019 2020 3 Baanoe Sheet Check OK OK OK OK OK 176 Assumplion 177 Revenue Growth -15% 178 COGS5% 179 Discount Rale 15% a EVEBITDA 5% -5% A +5%A Rank ABS Oatput Driver Pos Neg 181 The formula contained in the YELLOW cell (G179) is Hint: do not forget the $ when using absolute references. Use absolute reference so this formula can be copied over to other cells in this section without any manual modification =SMALL(E177:E180,$ F$179) SMALL(F177:F180,$ES179) -SMALL($F$177:$F$180,E179) =SMALL(SE$177:$E$180,F179) C G M H Historical Resubs Forecast Period CaFea l h 2 FINANCIAL STATEMENTS 3 Baknoe Sheet Check 2012 2011 2013 2014 2015 2016 2017 2018 2019 2020 OK OK OK OK OK OK OK OK OK 4 176 Assumption 177 Revenue Growth 15% 17 COGS+5 179 Discount Rate 5% a EVEBITDA 5% +5% A Rank ABS Pos Oatput Driver Neg 1a1 The formula contained in the ORANGE cell (H178) is (SA$177:$G$180, $F$177:$F$180,0),MATCH (SA$177,SA$177: SF$177,0)) Hint: do not forget the $ when using absolute references. What type of chart did we use to build a tornado chart? Tornado chart Column chart Clustered bar chart Stacked bar chart 10 Rank the assumptions (drivers) according to sensitivity from lowest to highest. Revenue growth +/-59% EV/EBITDA Exit +/-5% COGS +-5% Discount rate +/-5%