Answered step by step
Verified Expert Solution
Question
1 Approved Answer
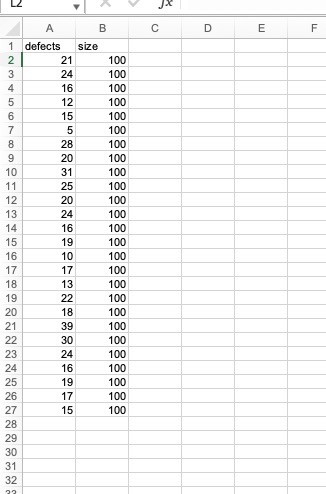
A 1 defects size B D E 88888888888888888888888888 2 21 3 24 4 16 5 12 6 15 7 5 8 28 9 20


A 1 defects size B D E 88888888888888888888888888 2 21 3 24 4 16 5 12 6 15 7 5 8 28 9 20 10 31 11 25 12 20 13 24 14 16 15 19 16 10 17 17 18 13 19 22 20 18 21 39 22 30 23 24 24 16 25 19 26 17 27 15 28 29 30 31 32 LL F QUESTION 1 Frozen orange juice concentrate is packed in 6-oz cardboard cans. These cans are formed on a machine by spinning them from cardboard stock and attaching a metal bottom panel. A can is then inspected to determine whether, when filled, the liquid could possibly leak either on the side ## seam or around the bottom joint. If this occurs, a can is considered nonconforming. The data were collected as 30 samples of 50 cans each at ## half-hour intervals over a three-shift period in which the machine was in continuous operation. Given the data in worksheet "OJ Cans", what is the Upper Control Limit## for the proportion defective (p-chart) given all samples are of size 50? Give your answer to 4 decimals. QUESTION 2 For the control chart created in Question 1, how many outliers are above the Upper Control Limit? QUESTION 3 What is the Upper Control Limit of the p-chart after the outliers are removed from the data set used in Question 1? Give your answer to 4 decimals.
Step by Step Solution
★★★★★
3.43 Rating (156 Votes )
There are 3 Steps involved in it
Step: 1
Question 1 To calculate the Upper Control Limit UCL for the proportion defective pchart we need to u...
Get Instant Access to Expert-Tailored Solutions
See step-by-step solutions with expert insights and AI powered tools for academic success
Step: 2

Step: 3

Ace Your Homework with AI
Get the answers you need in no time with our AI-driven, step-by-step assistance
Get Started


