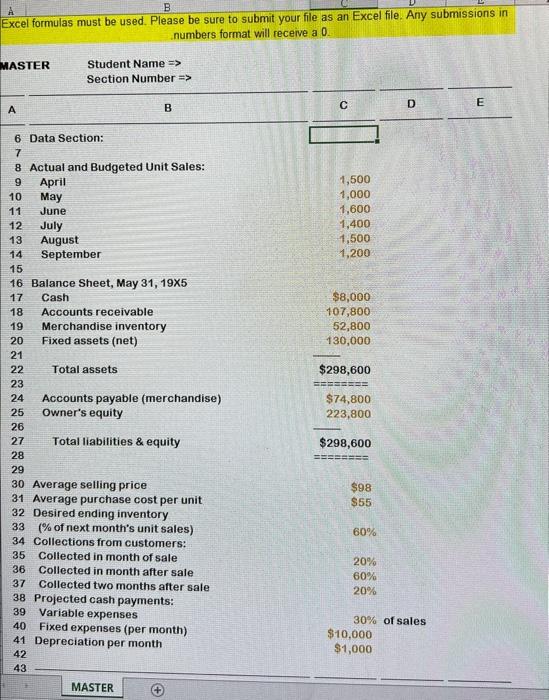
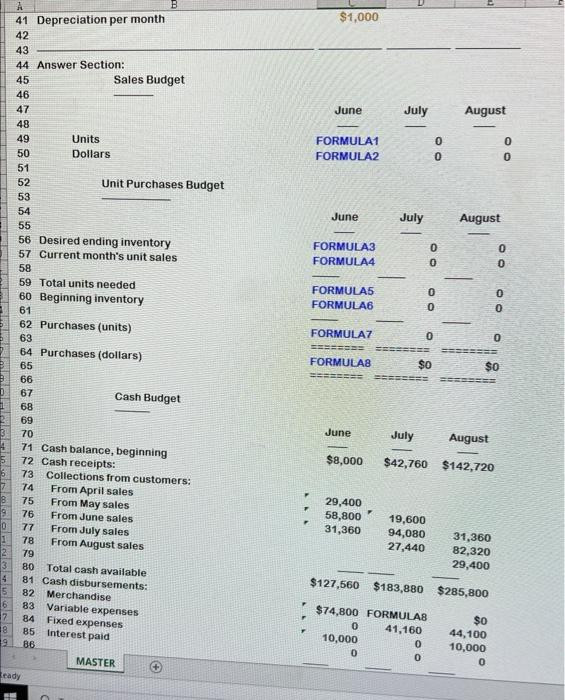
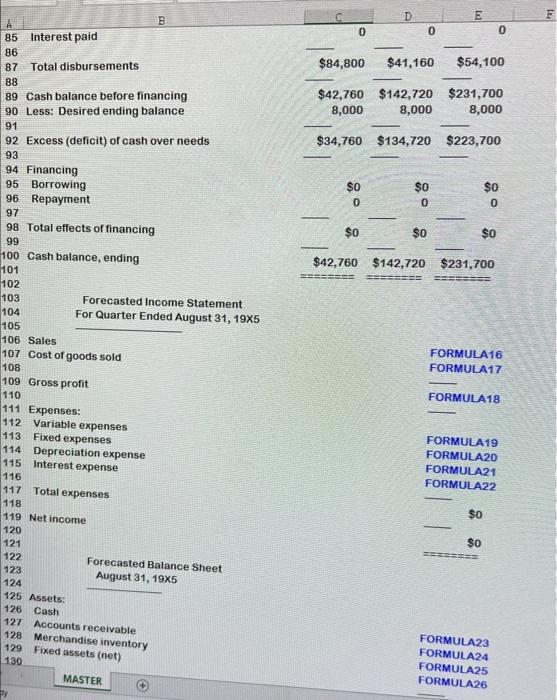
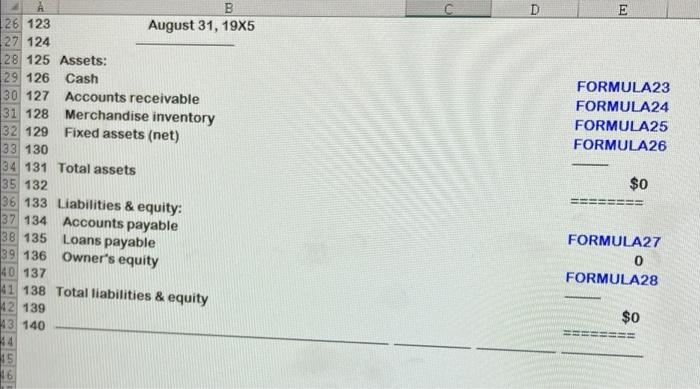
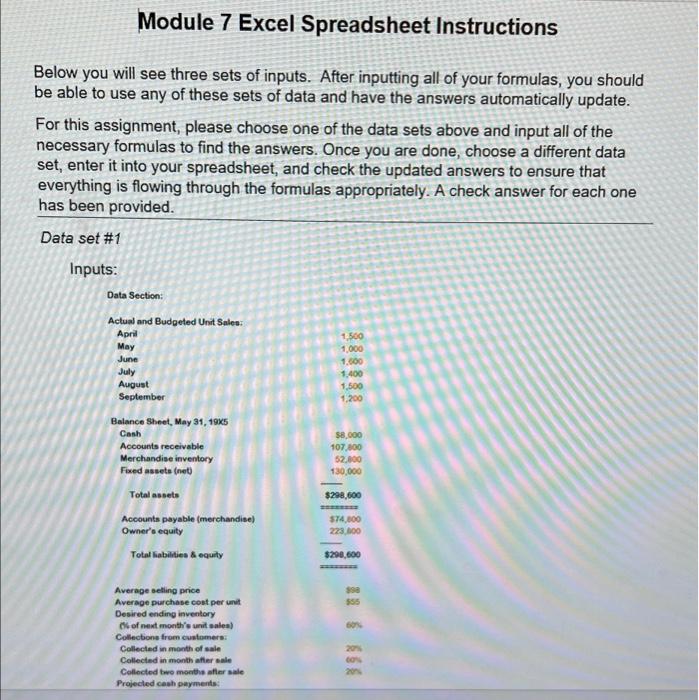
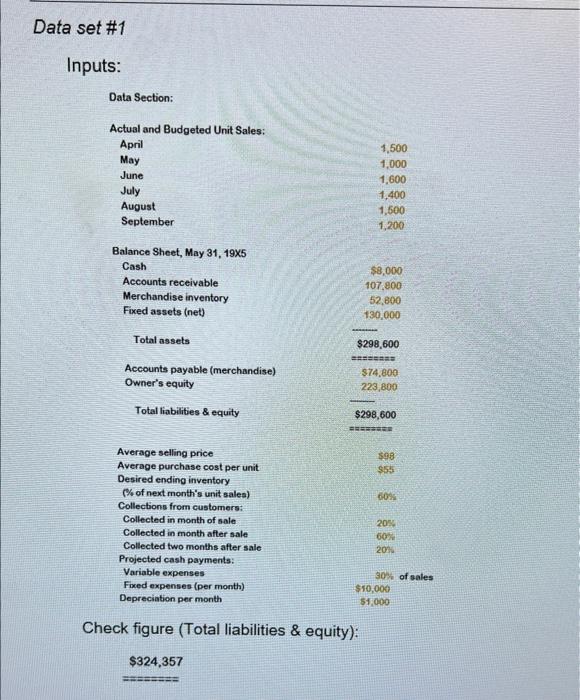
A B Excel formulas must be used. Please be sure to submit your file as an Excel file. Any submissions in numbers format will receive a 0 MASTER Student Name => Section Number => D B D E 1,500 1,000 1,600 1,400 1,500 1,200 $8,000 107,800 52,800 130,000 $298,600 6 Data Section: 7 8 Actual and Budgeted Unit Sales: 9 April 10 May 11 June 12 July 13 August 14 September 15 16 Balance Sheet, May 31, 1935 17 Cash 18 Accounts receivable 19 Merchandise inventory 20 Fixed assets (net) 21 22 Total assets 23 24 Accounts payable (merchandise) 25 Owner's equity 26 27 Total liabilities & equity 28 29 30 Average selling price 31 Average purchase cost per unit 32 Desired ending inventory 33 (% of next month's unit sales) 34 Collections from customers: 35 Collected in month of sale 36 Collected in month after sale 37 Collected two months after sale 38 Projected cash payments: 39 40 Fixed expenses (per month) 41 Depreciation per month 42 43 $74,800 223,800 $298,600 $98 $55 60% 20% 60% 20% Variable expenses 30% of sales $10,000 $1,000 MASTER $1,000 86 June July August FORMULA1 FORMULA2 0 0 OO June July August FORMULA3 FORMULA4 0 OO OO FORMULAS FORMULAR 0 0 0 0 FORMULAZ 0 O B A 41 Depreciation per month 42 43 44 Answer Section: 45 Sales Budget 46 47 48 49 Units 50 Dollars 51 52 Unit Purchases Budget 53 54 55 56 Desired ending inventory 57 Current month's unit sales 58 59 Total units needed 60 Beginning inventory 61 62 Purchases (units) 63 64 Purchases (dollars) 65 66 D 67 Cash Budget 1 68 69 70 71 Cash balance, beginning 72 Cash receipts: 73 Collections from customers: 74 From April sales 8 75 From May sales 76 From June sales 0 77 From July sales 1 78 From August sales 79 80 Total cash available 4 81 Cash disbursements: 82 Merchandise 6 83 7 84 18 19 86 MASTER Ready 0 FORMULAS $0 $0 June July August $8,000 $42,760 $142,720 29,400 58,800 31,360 19,600 94,080 27,440 31,360 82,320 29,400 $127,560 $183,880 $285,800 Variable expenses Fixed expenses 85 Interest paid $74,800 FORMULA 0 41,160 10,000 0 0 0 $0 44,100 10,000 0 D E E F 0 0 0 $84,800 $41,160 $54,100 $42,760 $142,720 $231,700 8,000 8,000 8,000 $34,760 $134,720 $223,700 $0 0 $0 0 $0 0 $0 $0 $0 B 85 Interest paid 86 87 Total disbursements 88 89 Cash balance before financing 90 Less: Desired ending balance 91 92 Excess (deficit) of cash over needs 93 94 Financing 95 Borrowing 96 Repayment 97 98 Total effects of financing 99 100 Cash balance, ending 101 102 103 Forecasted Income Statement 104 For Quarter Ended August 31, 1985 105 106 Sales 107 Cost of goods sold 108 109 Gross profit 110 111 Expenses: 112 Variable expenses 113 Fixed expenses 114 Depreciation expense 115 Interest expense $42,760 $142,720 $231,700 FORMULA16 FORMULA17 FORMULA18 FORMULA19 FORMULA20 FORMULA21 FORMULA22 116 $0 $o 117 Total expenses 118 119 Net income 120 121 122 Forecasted Balance Sheet 123 August 31, 19X5 124 125 Assets: Cash 127 Accounts receivable 128 Merchandise inventory 129 Fixed assets (net) 130 MASTER 126 FORMULA23 FORMULA24 FORMULA25 FORMULA26 D E FORMULA23 FORMULA24 FORMULA25 FORMULA26 B 126 123 August 31, 1985 127 124 28 125 Assets: 129 126 Cash 30 127 Accounts receivable 31 128 Merchandise inventory 32 129 Fixed assets (net) 33 130 34 131 Total assets 35 132 36 133 Liabilities & equity: 37 134 Accounts payable 38 135 Loans payable 39 136 Owner's equity 40 137 41 138 Total liabilities & equity 42 139 43 140 $0 FORMULA27 0 FORMULA28 $0 Module 7 Excel Spreadsheet Instructions Below you will see three sets of inputs. After inputting all of your formulas, you should be able to use any of these sets of data and have the answers automatically update. For this assignment, please choose one of the data sets above and input all of the necessary formulas to find the answers. Once you are done, choose a different data set, enter it into your spreadsheet, and check the updated answers to ensure that everything is flowing through the formulas appropriately. A check answer for each one has been provided. Data set #1 Inputs: Data Section: Actual and Budgeted Unit Sales: April May June July August September 1.500 1,000 1.600 1.400 1,500 1,200 $8,000 107.000 52.000 130,000 Balance Sheet, May 31, 1935 Cash Accounts receivable Merchandise inventory Fixed assets (net) Total assets Accounts payable (merchandise) Owner'e equity Total Habilities & equity $298,600 574,000 223 BOO $298.600 555 60 Average selling price Average purchase cost per unit Desired ending inventory Olof next month's salea) Collection from customers Collected in month of sale Collected in month after sale Collected two months after sale Projected cash payments 2013 GO 2013 Data set #1 Inputs: Data Section: Actual and Budgeted Unit Sales: April May June July August September 1,500 1,000 1,600 1,400 1,500 1,200 Balance Sheet, May 31, 1935 Cash Accounts receivable Merchandise inventory Fixed assets (net) $8,000 107,800 52,800 130.000 Total assets $298,600 Accounts payable (merchandise) Owner's equity Total liabilities & equity $74,800 223,800 $298,600 BER 598 $55 60% Average selling price Average purchase cost per unit Desired ending inventory (% of next month's unit sales) Collections from customers: Collected in month of sale Collected in month after sale Collected two months after sale Projected cash payments: Variable expenses Fixed expenses (per month) Depreciation per month 20% 60% 2011 30% of sales $10,000 51,000 Check figure (Total liabilities & equity): $324,357 A B Excel formulas must be used. Please be sure to submit your file as an Excel file. Any submissions in numbers format will receive a 0 MASTER Student Name => Section Number => D B D E 1,500 1,000 1,600 1,400 1,500 1,200 $8,000 107,800 52,800 130,000 $298,600 6 Data Section: 7 8 Actual and Budgeted Unit Sales: 9 April 10 May 11 June 12 July 13 August 14 September 15 16 Balance Sheet, May 31, 1935 17 Cash 18 Accounts receivable 19 Merchandise inventory 20 Fixed assets (net) 21 22 Total assets 23 24 Accounts payable (merchandise) 25 Owner's equity 26 27 Total liabilities & equity 28 29 30 Average selling price 31 Average purchase cost per unit 32 Desired ending inventory 33 (% of next month's unit sales) 34 Collections from customers: 35 Collected in month of sale 36 Collected in month after sale 37 Collected two months after sale 38 Projected cash payments: 39 40 Fixed expenses (per month) 41 Depreciation per month 42 43 $74,800 223,800 $298,600 $98 $55 60% 20% 60% 20% Variable expenses 30% of sales $10,000 $1,000 MASTER $1,000 86 June July August FORMULA1 FORMULA2 0 0 OO June July August FORMULA3 FORMULA4 0 OO OO FORMULAS FORMULAR 0 0 0 0 FORMULAZ 0 O B A 41 Depreciation per month 42 43 44 Answer Section: 45 Sales Budget 46 47 48 49 Units 50 Dollars 51 52 Unit Purchases Budget 53 54 55 56 Desired ending inventory 57 Current month's unit sales 58 59 Total units needed 60 Beginning inventory 61 62 Purchases (units) 63 64 Purchases (dollars) 65 66 D 67 Cash Budget 1 68 69 70 71 Cash balance, beginning 72 Cash receipts: 73 Collections from customers: 74 From April sales 8 75 From May sales 76 From June sales 0 77 From July sales 1 78 From August sales 79 80 Total cash available 4 81 Cash disbursements: 82 Merchandise 6 83 7 84 18 19 86 MASTER Ready 0 FORMULAS $0 $0 June July August $8,000 $42,760 $142,720 29,400 58,800 31,360 19,600 94,080 27,440 31,360 82,320 29,400 $127,560 $183,880 $285,800 Variable expenses Fixed expenses 85 Interest paid $74,800 FORMULA 0 41,160 10,000 0 0 0 $0 44,100 10,000 0 D E E F 0 0 0 $84,800 $41,160 $54,100 $42,760 $142,720 $231,700 8,000 8,000 8,000 $34,760 $134,720 $223,700 $0 0 $0 0 $0 0 $0 $0 $0 B 85 Interest paid 86 87 Total disbursements 88 89 Cash balance before financing 90 Less: Desired ending balance 91 92 Excess (deficit) of cash over needs 93 94 Financing 95 Borrowing 96 Repayment 97 98 Total effects of financing 99 100 Cash balance, ending 101 102 103 Forecasted Income Statement 104 For Quarter Ended August 31, 1985 105 106 Sales 107 Cost of goods sold 108 109 Gross profit 110 111 Expenses: 112 Variable expenses 113 Fixed expenses 114 Depreciation expense 115 Interest expense $42,760 $142,720 $231,700 FORMULA16 FORMULA17 FORMULA18 FORMULA19 FORMULA20 FORMULA21 FORMULA22 116 $0 $o 117 Total expenses 118 119 Net income 120 121 122 Forecasted Balance Sheet 123 August 31, 19X5 124 125 Assets: Cash 127 Accounts receivable 128 Merchandise inventory 129 Fixed assets (net) 130 MASTER 126 FORMULA23 FORMULA24 FORMULA25 FORMULA26 D E FORMULA23 FORMULA24 FORMULA25 FORMULA26 B 126 123 August 31, 1985 127 124 28 125 Assets: 129 126 Cash 30 127 Accounts receivable 31 128 Merchandise inventory 32 129 Fixed assets (net) 33 130 34 131 Total assets 35 132 36 133 Liabilities & equity: 37 134 Accounts payable 38 135 Loans payable 39 136 Owner's equity 40 137 41 138 Total liabilities & equity 42 139 43 140 $0 FORMULA27 0 FORMULA28 $0 Module 7 Excel Spreadsheet Instructions Below you will see three sets of inputs. After inputting all of your formulas, you should be able to use any of these sets of data and have the answers automatically update. For this assignment, please choose one of the data sets above and input all of the necessary formulas to find the answers. Once you are done, choose a different data set, enter it into your spreadsheet, and check the updated answers to ensure that everything is flowing through the formulas appropriately. A check answer for each one has been provided. Data set #1 Inputs: Data Section: Actual and Budgeted Unit Sales: April May June July August September 1.500 1,000 1.600 1.400 1,500 1,200 $8,000 107.000 52.000 130,000 Balance Sheet, May 31, 1935 Cash Accounts receivable Merchandise inventory Fixed assets (net) Total assets Accounts payable (merchandise) Owner'e equity Total Habilities & equity $298,600 574,000 223 BOO $298.600 555 60 Average selling price Average purchase cost per unit Desired ending inventory Olof next month's salea) Collection from customers Collected in month of sale Collected in month after sale Collected two months after sale Projected cash payments 2013 GO 2013 Data set #1 Inputs: Data Section: Actual and Budgeted Unit Sales: April May June July August September 1,500 1,000 1,600 1,400 1,500 1,200 Balance Sheet, May 31, 1935 Cash Accounts receivable Merchandise inventory Fixed assets (net) $8,000 107,800 52,800 130.000 Total assets $298,600 Accounts payable (merchandise) Owner's equity Total liabilities & equity $74,800 223,800 $298,600 BER 598 $55 60% Average selling price Average purchase cost per unit Desired ending inventory (% of next month's unit sales) Collections from customers: Collected in month of sale Collected in month after sale Collected two months after sale Projected cash payments: Variable expenses Fixed expenses (per month) Depreciation per month 20% 60% 2011 30% of sales $10,000 51,000 Check figure (Total liabilities & equity): $324,357