Answered step by step
Verified Expert Solution
Question
1 Approved Answer
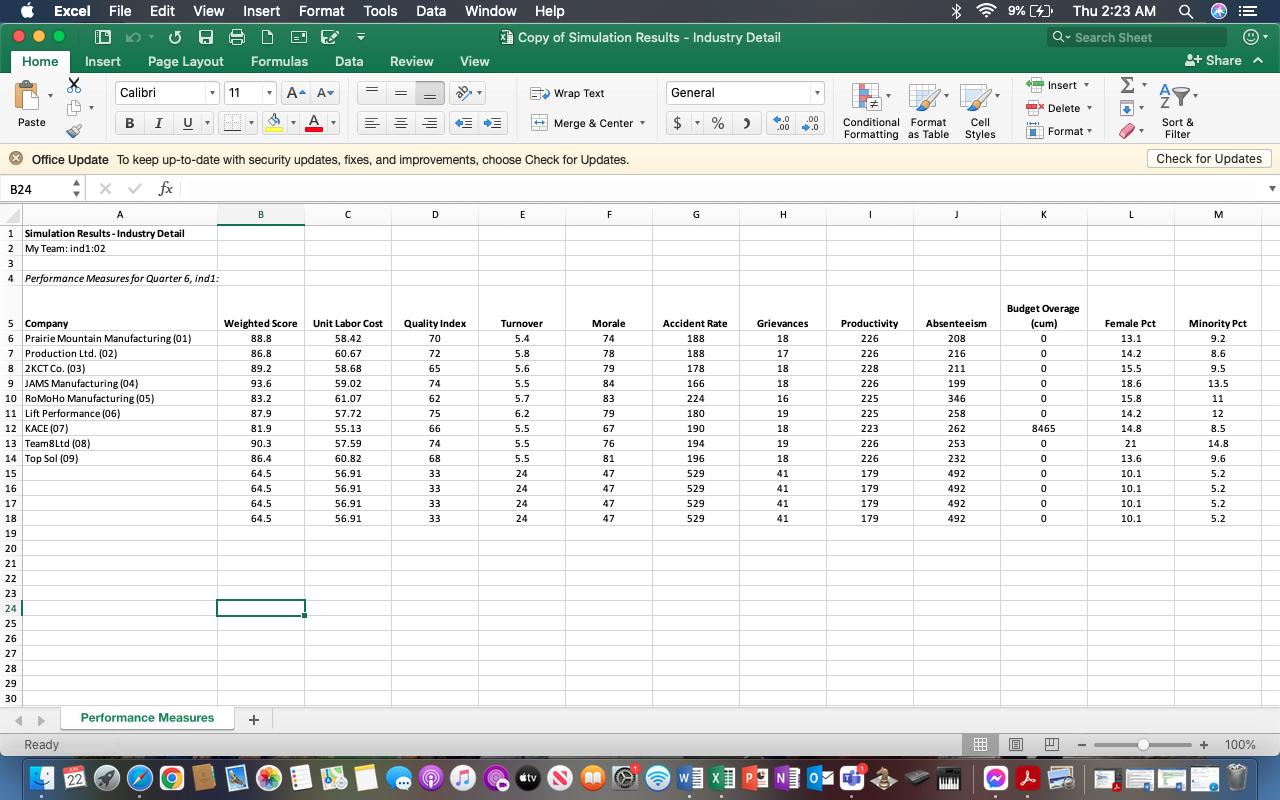
A Balanced Scorecard Analysis: A brief comparison and explanation of your team compared to the other teams in the simulation for your selected quarter. Please
A Balanced Scorecard Analysis:
- A brief comparison and explanation of your team compared to the other teams in the simulation for your selected quarter. Please include graphs or charts of simulation results comparing your team to the other teams in your class. Explain the following:
- Detail what decisions in the selected quarter worked for you as you thought they would? Why?
- Detail what decisions in the selected quarter did not have the effects you thought they would? Why not?
- product quality index
Be sure to include the following key performance indicators:
- productivity
- morale
- absenteeism
- accident rate
- turnover rate
- grievances
- female percentage
- minority percentage
- decision quality

B24 Home Excel File Edit View Insert Format Tools Data Window Help 5 8 H Insert Page Layout Paste 16 17 18 19 20 21 22 23 24 25 26 27 28 29 30 Y A 1 Simulation Results - Industry Detail 2 My Team: ind1:02 3 4 Performance Measures for Quarter 6, ind1: 14 Top Sol (09) 15 5 Company 6 Prairie Mountain Manufacturing (01) 7 Production Ltd. (02) 1 X 8 2KCT Co. (03) 9 JAMS Manufacturing (04) Calibri 10 RoMoHo Manufacturing (05) 11 Lift Performance (06) 12 KACE (07) 13 Team8Ltd (08) Ready BIU Office Update To keep up-to-date with security updates, fixes, and improvements, choose Check for Updates. fx SOND 22 Performance Measures 11 O Formulas Data R A+ A- Weighted Score 88.8 86.8 89.2 93.6 83.2 87.9 81.9 90.3 86.4 64.5 64.5 64.5 64.5 + A C Unit Labor Cost 58.42 60.67 58.68 59.02 61.07 57.72 55.13 57.59 60.82 Review 56.91 56.91 56.91 56.91 D View 74 62 20 Quality Index 70 72 65 ******** Ip Copy of Simulation Results - Industry Detail E Turnover 5.4 5.8 5.6 5.5 5.7 6.2 5.5 5.5 5.5 24 24 24 24 Wrap Text Merge & Center tv F Morale 74 78 79 84 83 79 67 76 81 47 47 47 47 O General $ % T G Accident Rate 8888 188 188 178 166 224 180 190 194 196 529 529 529 % > 529 W X +.0 .00 H .00 .0 Grievances 18 17 18 18 16 19 18 19 18 41 41 41 41 NO Conditional Format Formatting as Table 1 Productivity ************ J Absenteeism ***** 208 Cell Styles 216 211 199 346 258 262 253 232 492 492 492 492 www 9% [4] Thu 2:23 AM Q Search Sheet # K Insert Budget Overage (cum) 0 d Delete Format 0 0 0 0 0 8465 0 0 0 0 0 0 Lad AJ L Female Pct 13.1 14.2 15.5 18.6 15.8 14.2 14.8 21 13.6 10.1 10.1 10.1 10.1 + Share A AT. Sort & Filter Check for Updates = M Minority Pct *==3===3***** + 100%
Step by Step Solution
There are 3 Steps involved in it
Step: 1
To analyze the performance of your team compared to other teams in the simulation for the selected quarter well focus on the key performance indicator...
Get Instant Access to Expert-Tailored Solutions
See step-by-step solutions with expert insights and AI powered tools for academic success
Step: 2

Step: 3

Ace Your Homework with AI
Get the answers you need in no time with our AI-driven, step-by-step assistance
Get Started


