

Question
a. Based on the following 22 combinations of portfolio weights, calculate each of the 22 combination portfolio's return, standard deviation, and Sharpe ratio. This is
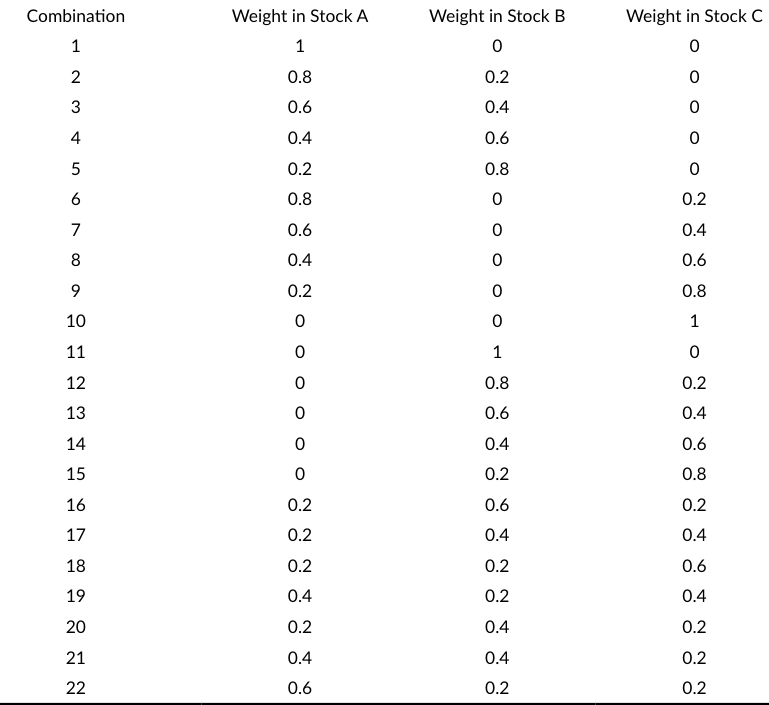
a. Based on the following 22 combinations of portfolio weights, calculate each of the 22 combination portfolio's return, standard deviation, and Sharpe ratio. This is known as the opportunity set. Based on your findings, identify the minimum variance portfolio and the tangent portfolio. Be as exact as you can.
 b. After identifying the tangent portfolio, plot the capital allocation line (CAL). Briefly explain the implication of your CAL, using numbers and values created from your findings above.
c. Would you consider your CAL the best achievable risk-reward combination? Suggest a number of industries/asset classes that you think would further enhance your risk-return tradeoffs. Be specific to the context and refer to the firms you chose above. Explain what would happen to your opportunity set and CAL if you are able to identify industries/asset classes that can improve the risk-return tradeoff.
Combination Weight in Stock A Weight in Stock B Weight in Stock C 1 1 0 0 2 0.8 0.2 0 3 0.6 0.4 0 4 0.4 0.6 0 5 0.2 0.8 0 6 0.8 0 0.2 7 0.6 0 0.4 8 0.4 0 0.6 9 0.2 o 0.8 10 0 0 1 11 0 1 0 12 0 0.8 0.2 13 0 0.6 0.4 14 0 0.4 0.6 15 0 0.2 0.8 16 0.2 0.6 0.2 17 0.2 0.4 0.4 18 0.2 0.2 0.6 19 0.4 0.2 0.4 20 0.2 0.4 0.2 21 0.4 0.4 0.2 22 0.6 0.2 0.2Step by Step Solution
There are 3 Steps involved in it
Step: 1

Get Instant Access to Expert-Tailored Solutions
See step-by-step solutions with expert insights and AI powered tools for academic success
Step: 2

Step: 3
Ace Your Homework with AI
Get the answers you need in no time with our AI-driven, step-by-step assistance
Get Started
Freedom And Finance Democratization And Institutional Investors In Developing Countries
Authors: M. Haley
1st Edition
0333914481, 1403940185, 9780333914489, 9781403940186