

Question
A. Based on world data of Government Consumption, World Demand and World Gross Domestic Product (GDP) in Index B in Excel Index file, compute the
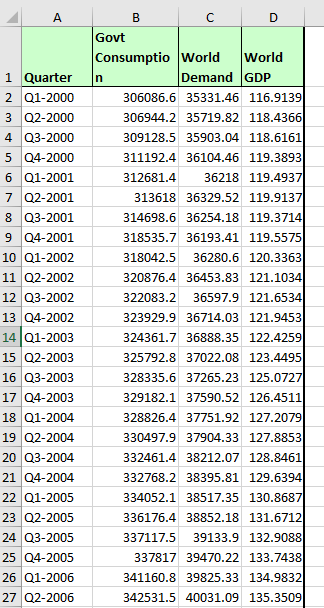
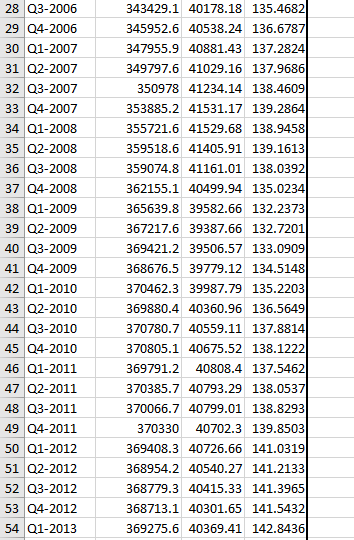
A. Based on world data of Government Consumption, World Demand and World Gross Domestic Product (GDP) in Index B in Excel Index file, compute the following:
i. Moving average of FOUR (4) quarters.
ii. Exponential smoothing with alpha () equal to 0.90.
iii. Rolling regression based on 4-quarter window.
iv. Plot the last 10 years graph of in-the-sample rolling regression forecasts of air transport passengers for the THREE (3) variables.
B. Calculate:
i. Mean absolute deviation (MAD) for all forecast models in questions A(i)(ii) and (iii) above.
ii. Mean squared errors (MSE) for all forecast models in questions A(i)(ii) and (iii) above.
iii. Mean absolute percentage errors (MAPE) for all forecast models in questions A(i)(ii) and (iii) above.
iv. Which model gives the nearest forecasts of all? [Explain your answer]
A B C D 1 Quarter 2 Q1-2000 3 Q2-2000 4 Q3-2000 5 Q4-2000 6 Q1-2001 7 Q2-2001 8 Q3-2001 9 04-2001 10 Q1-2002 11 Q2-2002 12 Q3-2002 13 Q4-2002 14 Q1-2003 15 Q2-2003 16 03-2003 17 Q4-2003 18 Q1-2004 19 Q2-2004 20 Q3-2004 21 04-2004 22 Q1-2005 23 Q2-2005 24 Q3-2005 25 Q4-2005 26 Q1-2006 27 Q2-2006 Govt Consumptio World World n Demand GDP 306086.6 35331.46 116.9139 306944.2 35719.82 118.4366 309128.5 35903.04 118.6161 311192.4 36104.46 119.3893 312681.4 36218 119.4937 313618 36329.52 119.9137 314698.6 36254.18 119.3714 318535.7 36193.41 119.5575 318042.5 36280.6 120.3363 320876.4 36453.83 121.1034 322083.2 36597.9 121.6534 323929.9 36714.03 121.9453 324361.7 36888.35 122.4259 325792.8 37022.08 123.4495 328335.6 37265.23 125.0727 329182.1 37590.52 126.4511 328826.4 37751.92 127.2079 330497.9 37904.33 127.8853 332461.4 38212.07 128.8461 332768.2 38395.81 129.6394 334052.1 38517.35 130.8687| 336176.4 38852.18 131.6712 337117.5 39133.9 132.9088 337817 39470.22 133.7438 341160.8 39825.33 134.9832 342531.5 40031.09 135.3509 28 Q3-2006 29 Q4-2006 30 Q1-2007 31 Q2-2007 32 Q3-2007 33 Q4-2007 34 Q1-2008 35 Q2-2008 36 Q3-2008 37 Q4-2008 38 Q1-2009 39 Q2-2009 40 Q3-2009 41 Q4-2009 42 Q1-2010 43 Q2-2010 44 Q3-2010 45 Q4-2010 46 Q1-2011 47 Q2-2011 48 Q3-2011 49 04-2011 50 Q1-2012 51 Q2-2012 52 Q3-2012 53 Q4-2012 54 Q1-2013 343429.1 40178.18 135.4682 345952.6 40538.24 136.6787 347955.9 40881.43 137.2824 349797.6 41029.16 137.9686 350978 41234.14 138.4609 353885.2 41531.17 139.2864 355721,6 41529.68 138.9458 359518.6 41405.91 139.1613 359074.8 41161.01 138.0392 362155.1 40499.94 135.0234 365639.8 39582.66 132.2373 367217.6 39387.66 132.7201 369421.2 39506.57 133.0909 368676.5 39779.12 134.5148 370462.3 39987.79 135.2203 369880.4 40360.96 136.5649 370780.7 40559.11 137.8814 370805.1 40675.52 138.1222 369791.2 40808.4 137.5462 370385.7 40793.29 138.0537 370066.7 40799.01 138.8293 370330 40702.3 139.8503 369408.3 40726.66 141.0319 368954.2 40540.27 141.2133 368779.3 40415.33 141.3965 368713.1 40301.65 141.5432 369275.6 40369.41 142.8436 A B C D 1 Quarter 2 Q1-2000 3 Q2-2000 4 Q3-2000 5 Q4-2000 6 Q1-2001 7 Q2-2001 8 Q3-2001 9 04-2001 10 Q1-2002 11 Q2-2002 12 Q3-2002 13 Q4-2002 14 Q1-2003 15 Q2-2003 16 03-2003 17 Q4-2003 18 Q1-2004 19 Q2-2004 20 Q3-2004 21 04-2004 22 Q1-2005 23 Q2-2005 24 Q3-2005 25 Q4-2005 26 Q1-2006 27 Q2-2006 Govt Consumptio World World n Demand GDP 306086.6 35331.46 116.9139 306944.2 35719.82 118.4366 309128.5 35903.04 118.6161 311192.4 36104.46 119.3893 312681.4 36218 119.4937 313618 36329.52 119.9137 314698.6 36254.18 119.3714 318535.7 36193.41 119.5575 318042.5 36280.6 120.3363 320876.4 36453.83 121.1034 322083.2 36597.9 121.6534 323929.9 36714.03 121.9453 324361.7 36888.35 122.4259 325792.8 37022.08 123.4495 328335.6 37265.23 125.0727 329182.1 37590.52 126.4511 328826.4 37751.92 127.2079 330497.9 37904.33 127.8853 332461.4 38212.07 128.8461 332768.2 38395.81 129.6394 334052.1 38517.35 130.8687| 336176.4 38852.18 131.6712 337117.5 39133.9 132.9088 337817 39470.22 133.7438 341160.8 39825.33 134.9832 342531.5 40031.09 135.3509 28 Q3-2006 29 Q4-2006 30 Q1-2007 31 Q2-2007 32 Q3-2007 33 Q4-2007 34 Q1-2008 35 Q2-2008 36 Q3-2008 37 Q4-2008 38 Q1-2009 39 Q2-2009 40 Q3-2009 41 Q4-2009 42 Q1-2010 43 Q2-2010 44 Q3-2010 45 Q4-2010 46 Q1-2011 47 Q2-2011 48 Q3-2011 49 04-2011 50 Q1-2012 51 Q2-2012 52 Q3-2012 53 Q4-2012 54 Q1-2013 343429.1 40178.18 135.4682 345952.6 40538.24 136.6787 347955.9 40881.43 137.2824 349797.6 41029.16 137.9686 350978 41234.14 138.4609 353885.2 41531.17 139.2864 355721,6 41529.68 138.9458 359518.6 41405.91 139.1613 359074.8 41161.01 138.0392 362155.1 40499.94 135.0234 365639.8 39582.66 132.2373 367217.6 39387.66 132.7201 369421.2 39506.57 133.0909 368676.5 39779.12 134.5148 370462.3 39987.79 135.2203 369880.4 40360.96 136.5649 370780.7 40559.11 137.8814 370805.1 40675.52 138.1222 369791.2 40808.4 137.5462 370385.7 40793.29 138.0537 370066.7 40799.01 138.8293 370330 40702.3 139.8503 369408.3 40726.66 141.0319 368954.2 40540.27 141.2133 368779.3 40415.33 141.3965 368713.1 40301.65 141.5432 369275.6 40369.41 142.8436Step by Step Solution
There are 3 Steps involved in it
Step: 1

Get Instant Access to Expert-Tailored Solutions
See step-by-step solutions with expert insights and AI powered tools for academic success
Step: 2

Step: 3
Ace Your Homework with AI
Get the answers you need in no time with our AI-driven, step-by-step assistance
Get Started
The Art Of Distressed M And A Buying Selling And Financing Troubled And Insolvent Companies
Authors: H. Peter Nesvold, Jeffrey Anapolsky , Alexandra Reed Lajoux
1st Edition
0071750193,0071750304