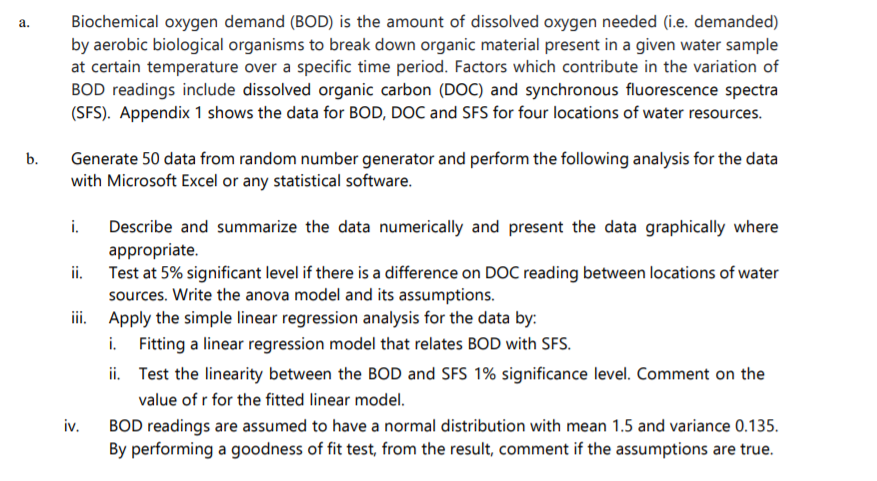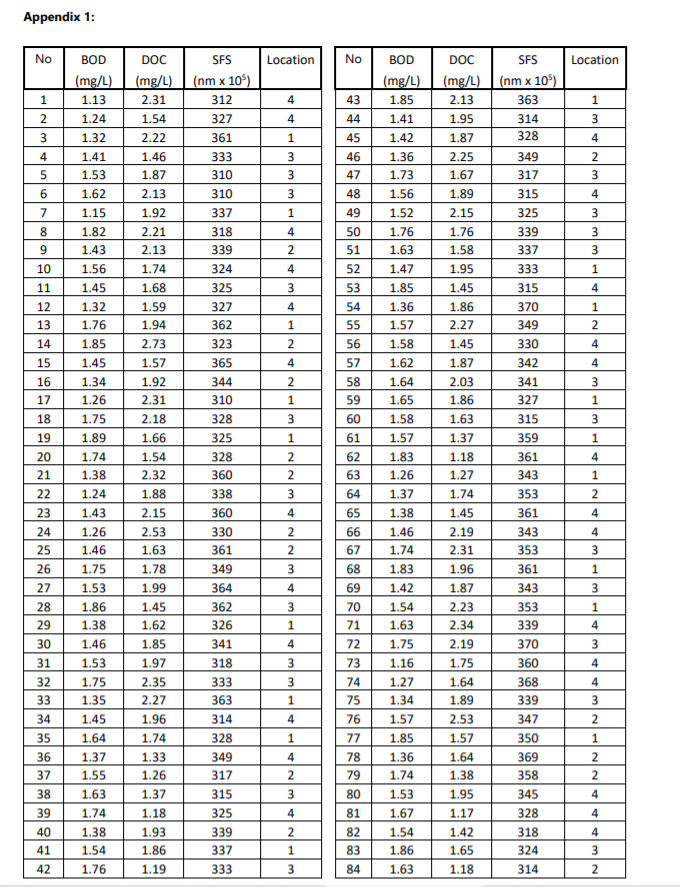

a. Biochemical oxygen demand (BOD) is the amount of dissolved oxygen needed (i.e. demanded) by aerobic biological organisms to break down organic material present in a given water sample at certain temperature over a specific time period. Factors which contribute in the variation of BOD readings include dissolved organic carbon (DOC) and synchronous fluorescence spectra (SFS). Appendix 1 shows the data for BOD, DOC and SFS for four locations of water resources. b. Generate 50 data from random number generator and perform the following analysis for the data with Microsoft Excel or any statistical software. i. Describe and summarize the data numerically and present the data graphically where appropriate. ii. Test at 5% significant level if there is a difference on DOC reading between locations of water sources. Write the anova model and its assumptions. iii. Apply the simple linear regression analysis for the data by: i. Fitting a linear regression model that relates BOD with SFS. ii. Test the linearity between the BOD and SFS 1% significance level. Comment on the value of r for the fitted linear model. iv. BOD readings are assumed to have a normal distribution with mean 1.5 and variance 0.135. By performing a goodness of fit test, from the result, comment if the assumptions are true. Appendix 1: No Location No Location BOD (mg/L) 1.13 SFS (nm x 105) 312 SFS (nm x 10) 363 1 4 1 2 1.24 4 3 314 328 3 DOC (mg/L) 2.31 1.54 2.22 1.46 1.87 2.13 1.92 4 4 5 1 3 3 2 327 361 333 310 310 337 45 46 47 349 317 3 3 315 1.32 1.41 1.53 1.62 1.15 1.82 1.43 1.56 1.45 4 6 7 1 3 4 8 9 2.21 2.13 1.74 318 339 3 3 2 10 4 325 339 337 333 315 370 349 324 325 1 11 4 3 4 1 12 13 1.32 1.76 1 2 327 362 323 365 2 330 4 4 4 14 15 16 17 344 2 3 1 58 59 60 1 310 328 325 3 18 19 3 1 1 328 DOC (mg/L) 2.13 1.95 1.87 2.25 1.67 1.89 2.15 1.76 1.58 1.95 1.45 1.86 2.27 1.45 1.87 2.03 1.86 1.63 1.37 1.18 1.27 1.74 1.45 2.19 2.31 1.96 1.87 2.23 2.34 2.19 1.75 1.64 1.89 2.53 1.57 1.64 1.38 1.95 1.17 4 20 21 22 2 2 BOD (mg/L) 1.85 1.41 1.42 1.36 1.73 1.56 1.52 1.76 1.63 1.47 1.85 1.36 1.57 1.58 1.62 1.64 1.65 1.58 1.57 1.83 1.26 1.37 1.38 1.46 1.74 1.83 1.42 1.54 1.63 1.75 1.16 1.27 1.34 1.57 1.85 1.36 1.74 1.53 1.67 1.54 1.86 1.63 360 1 3 2 4 4 1.68 1.59 1.94 2.73 1.57 1.92 2.31 2.18 1.66 1.54 2.32 1.88 2.15 2.53 1.63 1.78 1.99 1.45 1.62 1.85 1.97 2.35 2.27 1.96 1.74 1.33 1.26 1.37 1.85 1.45 1.34 1.26 1.75 1.89 1.74 1.38 1.24 1.43 1.26 1.46 1.75 1.53 1.86 1.38 1.46 1.53 1.75 1.35 1.45 1.64 1.37 1.55 1.63 2 2 4 3 23 24 25 26 27 28 29 30 342 341 327 315 359 361 343 353 361 343 353 361 343 353 339 370 360 368 339 3 1 3 4 3 1 1 4 3 338 360 330 361 349 364 362 326 341 318 333 363 314 328 349 317 315 325 339 337 4 4 3 3 1 68 69 70 71 72 73 74 75 76 77 78 31 32 33 34 35 36 4 347 4 1 3 2 1 350 369 358 4 2 3 2 79 2 4 BB 18 16 11 80 81 1.74 1.18 4 345 328 318 324 4 1.38 1.54 1.76 4 2 1 3 1.93 1.86 82 83 1.42 1.65 3 1.19 333 84 1.18 314 2 a. Biochemical oxygen demand (BOD) is the amount of dissolved oxygen needed (i.e. demanded) by aerobic biological organisms to break down organic material present in a given water sample at certain temperature over a specific time period. Factors which contribute in the variation of BOD readings include dissolved organic carbon (DOC) and synchronous fluorescence spectra (SFS). Appendix 1 shows the data for BOD, DOC and SFS for four locations of water resources. b. Generate 50 data from random number generator and perform the following analysis for the data with Microsoft Excel or any statistical software. i. Describe and summarize the data numerically and present the data graphically where appropriate. ii. Test at 5% significant level if there is a difference on DOC reading between locations of water sources. Write the anova model and its assumptions. iii. Apply the simple linear regression analysis for the data by: i. Fitting a linear regression model that relates BOD with SFS. ii. Test the linearity between the BOD and SFS 1% significance level. Comment on the value of r for the fitted linear model. iv. BOD readings are assumed to have a normal distribution with mean 1.5 and variance 0.135. By performing a goodness of fit test, from the result, comment if the assumptions are true. Appendix 1: No Location No Location BOD (mg/L) 1.13 SFS (nm x 105) 312 SFS (nm x 10) 363 1 4 1 2 1.24 4 3 314 328 3 DOC (mg/L) 2.31 1.54 2.22 1.46 1.87 2.13 1.92 4 4 5 1 3 3 2 327 361 333 310 310 337 45 46 47 349 317 3 3 315 1.32 1.41 1.53 1.62 1.15 1.82 1.43 1.56 1.45 4 6 7 1 3 4 8 9 2.21 2.13 1.74 318 339 3 3 2 10 4 325 339 337 333 315 370 349 324 325 1 11 4 3 4 1 12 13 1.32 1.76 1 2 327 362 323 365 2 330 4 4 4 14 15 16 17 344 2 3 1 58 59 60 1 310 328 325 3 18 19 3 1 1 328 DOC (mg/L) 2.13 1.95 1.87 2.25 1.67 1.89 2.15 1.76 1.58 1.95 1.45 1.86 2.27 1.45 1.87 2.03 1.86 1.63 1.37 1.18 1.27 1.74 1.45 2.19 2.31 1.96 1.87 2.23 2.34 2.19 1.75 1.64 1.89 2.53 1.57 1.64 1.38 1.95 1.17 4 20 21 22 2 2 BOD (mg/L) 1.85 1.41 1.42 1.36 1.73 1.56 1.52 1.76 1.63 1.47 1.85 1.36 1.57 1.58 1.62 1.64 1.65 1.58 1.57 1.83 1.26 1.37 1.38 1.46 1.74 1.83 1.42 1.54 1.63 1.75 1.16 1.27 1.34 1.57 1.85 1.36 1.74 1.53 1.67 1.54 1.86 1.63 360 1 3 2 4 4 1.68 1.59 1.94 2.73 1.57 1.92 2.31 2.18 1.66 1.54 2.32 1.88 2.15 2.53 1.63 1.78 1.99 1.45 1.62 1.85 1.97 2.35 2.27 1.96 1.74 1.33 1.26 1.37 1.85 1.45 1.34 1.26 1.75 1.89 1.74 1.38 1.24 1.43 1.26 1.46 1.75 1.53 1.86 1.38 1.46 1.53 1.75 1.35 1.45 1.64 1.37 1.55 1.63 2 2 4 3 23 24 25 26 27 28 29 30 342 341 327 315 359 361 343 353 361 343 353 361 343 353 339 370 360 368 339 3 1 3 4 3 1 1 4 3 338 360 330 361 349 364 362 326 341 318 333 363 314 328 349 317 315 325 339 337 4 4 3 3 1 68 69 70 71 72 73 74 75 76 77 78 31 32 33 34 35 36 4 347 4 1 3 2 1 350 369 358 4 2 3 2 79 2 4 BB 18 16 11 80 81 1.74 1.18 4 345 328 318 324 4 1.38 1.54 1.76 4 2 1 3 1.93 1.86 82 83 1.42 1.65 3 1.19 333 84 1.18 314 2


