A BMW car dealer in Sicilia, Italy, has the following monthly new car sales data for January through December 2014. The dealer believes that new car sales follow a monthly seasonal pattern and computed the seasonal indices for each of the 12 months, which are also given in the following table:
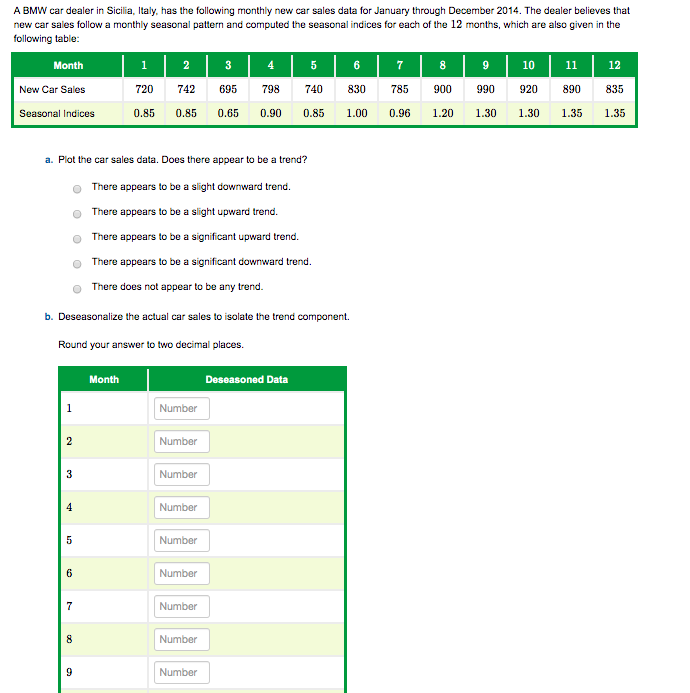
A BMW car dealer in Sicilia, Italy, has the following monthly new car sales data for January through December 2014. The dealer believes that new car sales follow a monthly seasonal pattern and computed the seasonal indices for each of the 12 months, which are also given in the following table: | | | | Month New Car Sales Seasonal Indices 1 720 0.85 2 742 0.85 3 695 0.65 | 4 798 0.90 5 740 0.85 6 830 1.00 7 785 0.96 8 900 1.20 9 990 1.30 10 920 1.30 11 890 1.35 12 835 1.35 a. Plot the car sales data. Does there appear to be a trend? There appears to be a slight downward trend. There appears to be a slight upward trend. There appears to be a significant upward trend. There appears to be a significant downward trend. There does not appear to be any trend. b. Deseasonalize the actual car sales to isolate the trend component Round your answer to two decimal places. Month Deseasoned Data Number Number Number Number Number Number Number Number Number Number Number Number 12 Number c. Develop a linear trend equation using the deseasonalized data. Round each calculated value to two decimal places. Do not use commas in your answer. Use as the independent variable. Yc = d. Develop a trend forecast for January and February 2015. Round your answers to two decimal places. The forecasted new car sales in 2015 for January is $ Number and February is 8 Number e. Develop a seasonalized forecast for January and February 2015. Round your answers to two decimal places. The seasonalized forecast for new car sales in 2015 for January is S Number and February is S Number . A BMW car dealer in Sicilia, Italy, has the following monthly new car sales data for January through December 2014. The dealer believes that new car sales follow a monthly seasonal pattern and computed the seasonal indices for each of the 12 months, which are also given in the following table: | | | | Month New Car Sales Seasonal Indices 1 720 0.85 2 742 0.85 3 695 0.65 | 4 798 0.90 5 740 0.85 6 830 1.00 7 785 0.96 8 900 1.20 9 990 1.30 10 920 1.30 11 890 1.35 12 835 1.35 a. Plot the car sales data. Does there appear to be a trend? There appears to be a slight downward trend. There appears to be a slight upward trend. There appears to be a significant upward trend. There appears to be a significant downward trend. There does not appear to be any trend. b. Deseasonalize the actual car sales to isolate the trend component Round your answer to two decimal places. Month Deseasoned Data Number Number Number Number Number Number Number Number Number Number Number Number 12 Number c. Develop a linear trend equation using the deseasonalized data. Round each calculated value to two decimal places. Do not use commas in your answer. Use as the independent variable. Yc = d. Develop a trend forecast for January and February 2015. Round your answers to two decimal places. The forecasted new car sales in 2015 for January is $ Number and February is 8 Number e. Develop a seasonalized forecast for January and February 2015. Round your answers to two decimal places. The seasonalized forecast for new car sales in 2015 for January is S Number and February is S Number