Question
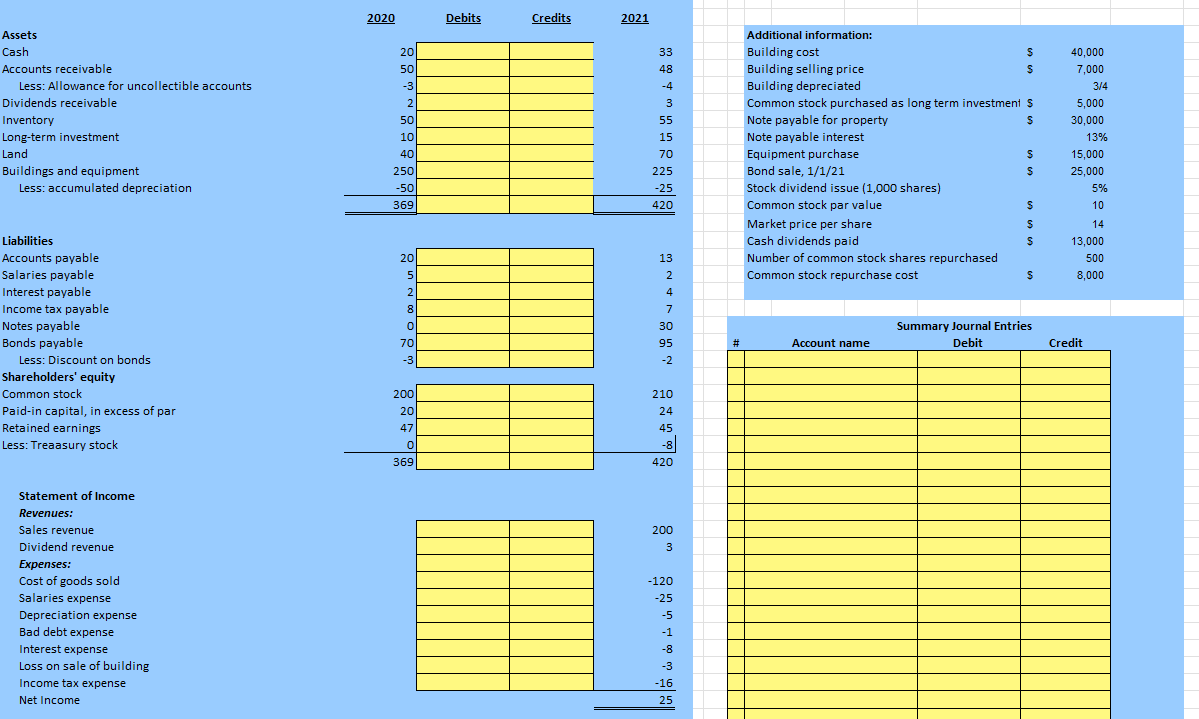
A building that originally cost $40,000, and which was three-fourths depreciated, was sold for $7,000. The common stock of Byrd Corporation was purchased for $5,000
A building that originally cost $40,000, and which was three-fourths depreciated, was sold for $7,000.
The common stock of Byrd Corporation was purchased for $5,000 as a long-term investment.
Property was acquired by issuing a 13%, seven-year, $30,000 note payable to the seller.
New equipment was purchased for $15,000 cash.
On January 1, 2021, bonds were sold at their $25,000 face value.
On January 19, Dux issued a 5% stock dividend (1,000 shares). The market price of the $10 par value common stock was $14 per share at that time.
Cash dividends of $13,000 were paid to shareholders.
On November 12, 500 shares of common stock were repurchased as treasury stock at a cost of $8,000.


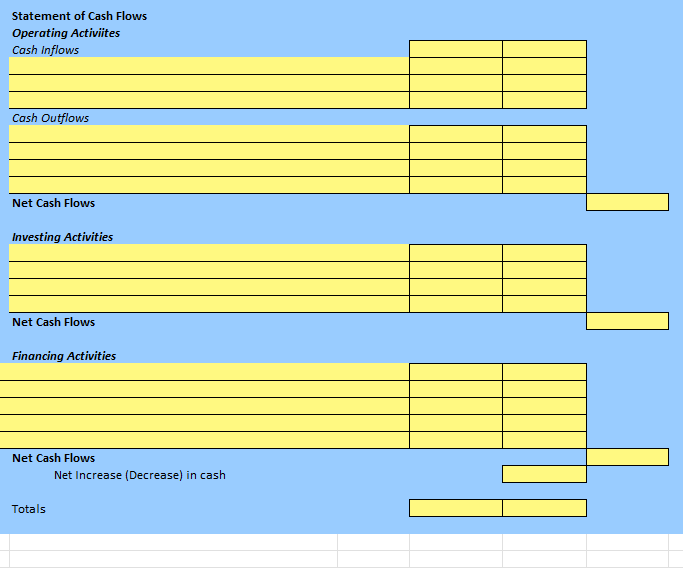
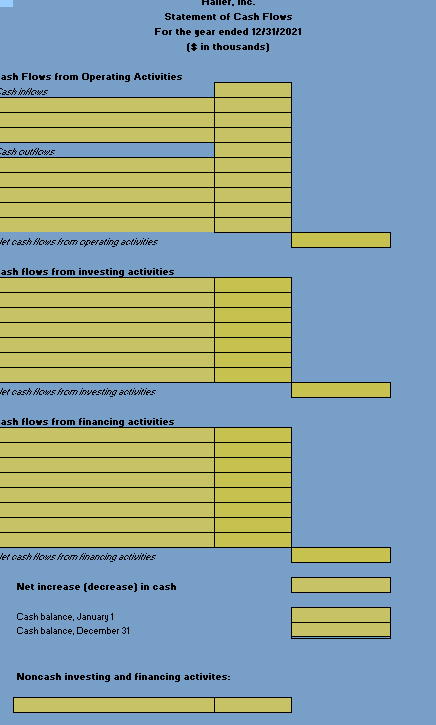
 Assets Cash Accounts receivable Less: Allowance for uncollectible accounts Dividends receivable Inventory Long-term investment Land Buildings and equipment Less: accumulated depreciation Liabilities Accounts payable Salaries payable Interest payable Income tax payable Notes payable Bonds payable Less: Discount on bonds Shareholders' equity Common stock Paid-in capital, in excess of par Retained earnings Less: Treaasury stock Statement of Income Revenues: Sales revenue Dividend revenue Expenses: Cost of goods sold Salaries expense Depreciation expense Bad debt expense Interest expense Loss on sale of building Income tax expense Net Income \begin{tabular}{|l|l|} \hline & \\ \hline & \\ \hline & \\ \hline & \\ \hline & \\ \hline & \\ \hline & \\ \hline & \\ \hline & \\ \hline & \end{tabular} Additional information: Building cost Building selling price Building depreciated Common stock purchased as long term investment \$ Note payable for property Note payable interest Equipment purchase Bond sale, 1/1/21 Stock dividend issue (1,000 shares) Common stock par value Market price per share Cash dividends paid Number of common stock shares repurchased Common stock repurchase cost SSsSSSsSSS40,0007,0003/45,00030,00013%15,00025,0005%101413,0005008,000 Statement of Cash Flows Operating Activiites Cash Inflows Cash Outflows Net Cash Flows Investing Activities \begin{tabular}{|l|l|l|} \hline & & \\ \hline & & \\ \hline Net Cash Flows & & \\ \hline \end{tabular} Financing Activities \begin{tabular}{l|l|l|} \hline & & \\ \hline & & \\ \hline & & \\ \hline Net Cash Flows & & \\ \hline Net Increase (Decrease) in cash & & \\ \hline Totals & & \\ \hline \end{tabular} Statement of Cash Flows For the gear ended 12131/2021 [ $ in thousands] ash Flows from Operating Activities ash flows from investing activities ash flows from financing activities \begin{tabular}{|l|l|} \hline & \\ \hline & \\ \hline & \\ \hline & \\ \hline & \\ \hline & \\ \hline & \\ \hline \end{tabular} Net increase [decrease] in cash Cash balance, January 1 Cash balance, December 31 Noncash investing and financing activites
 Step by Step Solution
There are 3 Steps involved in it
Step: 1

Get Instant Access to Expert-Tailored Solutions
See step-by-step solutions with expert insights and AI powered tools for academic success
Step: 2

Step: 3

Ace Your Homework with AI
Get the answers you need in no time with our AI-driven, step-by-step assistance
Get Started


