Question
A business entrepreneur is considering several potential sites for a restaurant. Each of the entrepreneur's sites is a store rental space located in an outdoor
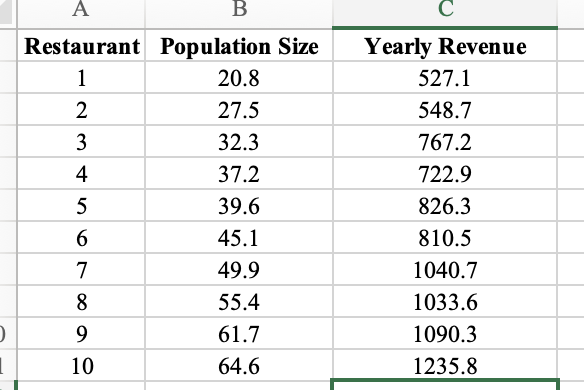
A business entrepreneur is considering several potential sites for a restaurant. Each of the entrepreneur's sites is a store rental space located in an outdoor shopping area that is close to one or more residential areas. For a restaurant built on such a site, yearly revenue is known to depend on the number of residents living near the site. Referring to the number of residents living near a site as population size and to the yearly revenue for a restaurant built on the site as yearly revenue, the entrepreneur will try to predict yearly revenue (y) on the basis of population size (x). The entrepreneur randomly selects 10 restaurants that are built on sites similar to the sites that the entrepreneur is considering. The entrepreneur then asks the owner of each restaurant what the restaurant's revenue was last year and estimates?with the help of the owner and published demographic information?the number of residents, or population size, living near the site. The Excel file "Tasty Restaurant.xlsx Download Tasty Restaurant.xlsx" contains the values of y (measured in thousands of dollars) and x (measured in thousands of residents) that are obtained.
- Insert two worksheets named "Scatter Diagram" and "Regression".
- Construct a scatter diagram for these data in the worksheet "Scatter Diagram".
- Use Excel's Regression tool to develop the estimated regression equation, and report the regression results in the worksheet "Regression".
UploadChoose a File
Question 2
D. What does the scatter diagram indicate about the relationship between yearly revenue and population size?
Group of answer choices
There appears to be a positive linear relationship between the size of the student population and quarterly sales.
There appears to be no linear relationship between the size of the student population and quarterly sales.
There appears to be a negative linear relationship between the size of the student population and quarterly sales.

Step by Step Solution
There are 3 Steps involved in it
Step: 1

Get Instant Access to Expert-Tailored Solutions
See step-by-step solutions with expert insights and AI powered tools for academic success
Step: 2

Step: 3

Ace Your Homework with AI
Get the answers you need in no time with our AI-driven, step-by-step assistance
Get Started


