

Question
(a) By referencing cells shown in Figure 2, write the Excel formula for the expected return of Proposed Portfolio 1, and the standard deviation for
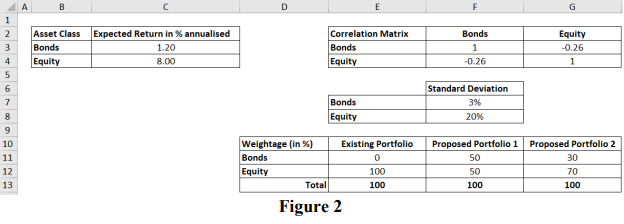
(a) By referencing cells shown in Figure 2, write the Excel formula for the expected return of Proposed Portfolio 1, and the standard deviation for Proposed Portfolio 1. (4 marks)
(b) Calculate the expected returns of Proposed Portfolio 1 and Proposed Portfolio 2. (2 marks)
(c) Calculate the standard deviations (risk) of Proposed Portfolios 1 and 2. (2 marks)
(d) Explain your findings in (b) and (c). (4 marks)
(e) List one (1) reason for the benefit of having new portfolios constructed from different asset classes such as from bonds and equities in this example, rather than concentrating on having a portfolio that is made up of equities only, from a risk perspective. Use data in Figure 2 to explain your reason. (4 marks)
(f) List two (2) reasons that the U.S. Equity Fund does not focus on a handful (say, the top 5) of the highest dividend-paying U.S. stocks, but rather include a basket of around 30 to 50 financially sound U.S. stocks, well-diversified from various industries. (4 marks)
\begin{tabular}{|c|} \hline \end{tabular} \begin{tabular}{|l|c|} \hline Asset Class & Expected Return in \% annualised \\ \hline Bonds & 1.20 \\ \hline Equity & 8.00 \\ \hline \end{tabular} \begin{tabular}{|l|c|c|} \hline Correlation Matrix & Bonds & Equity \\ \hline Bonds & 1 & 0.26 \\ \hline Equity & 0.26 & 1 \\ \hline \end{tabular} \begin{tabular}{|l|c|} \cline { 2 } \multicolumn{1}{c|}{} & Standard Deviation \\ \hline Bonds & 3% \\ \hline Equity & 20% \\ \hline \end{tabular} \begin{tabular}{|l|c|c|c|} \hline Weightage (in \%) & Existing Portfolio & Proposed Portfolio 1 & Proposed Portfolio 2 \\ \hline Bonds & 0 & 50 & 30 \\ \hline Equity & 100 & 50 & 70 \\ \hline \multicolumn{1}{|l|}{ Total } & 100 & 100 & 100 \\ \hline \end{tabular} Figure 2 \begin{tabular}{|c|} \hline \end{tabular} \begin{tabular}{|l|c|} \hline Asset Class & Expected Return in \% annualised \\ \hline Bonds & 1.20 \\ \hline Equity & 8.00 \\ \hline \end{tabular} \begin{tabular}{|l|c|c|} \hline Correlation Matrix & Bonds & Equity \\ \hline Bonds & 1 & 0.26 \\ \hline Equity & 0.26 & 1 \\ \hline \end{tabular} \begin{tabular}{|l|c|} \cline { 2 } \multicolumn{1}{c|}{} & Standard Deviation \\ \hline Bonds & 3% \\ \hline Equity & 20% \\ \hline \end{tabular} \begin{tabular}{|l|c|c|c|} \hline Weightage (in \%) & Existing Portfolio & Proposed Portfolio 1 & Proposed Portfolio 2 \\ \hline Bonds & 0 & 50 & 30 \\ \hline Equity & 100 & 50 & 70 \\ \hline \multicolumn{1}{|l|}{ Total } & 100 & 100 & 100 \\ \hline \end{tabular} Figure 2Step by Step Solution
There are 3 Steps involved in it
Step: 1

Get Instant Access to Expert-Tailored Solutions
See step-by-step solutions with expert insights and AI powered tools for academic success
Step: 2

Step: 3
Ace Your Homework with AI
Get the answers you need in no time with our AI-driven, step-by-step assistance
Get Started
A Handbook Of Mutual Fund Investing
Authors: Barry G Dolgin
1st Edition
1456489704, 978-1456489700