a) calculate and explain:
Profitability ratios:
-Total Margin
-Operating Margin
-Return on Assets
-Return on Equity
Liquidity Ratios:
-Current ratio
-Days Cash on hand
Debt Ratio:
-Debt Ratio
b)Interpret ratios above
These are statements from the question:
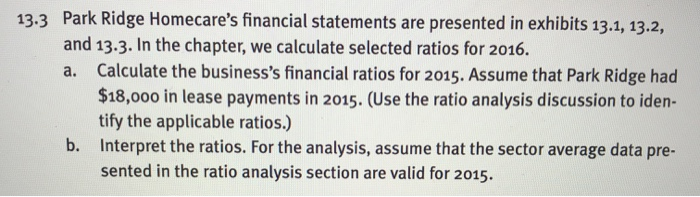
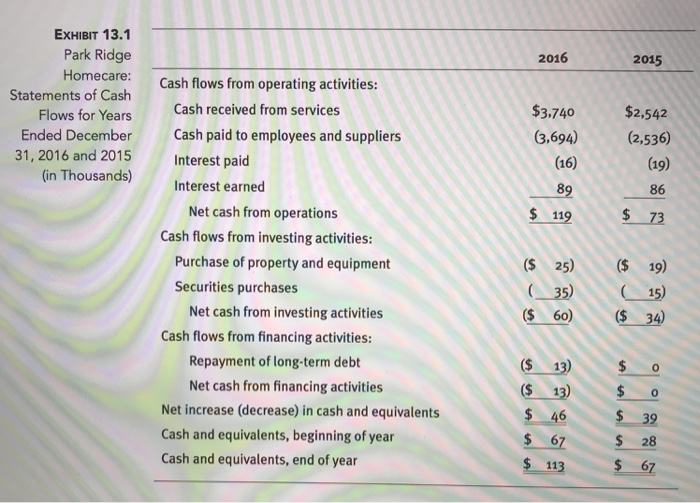
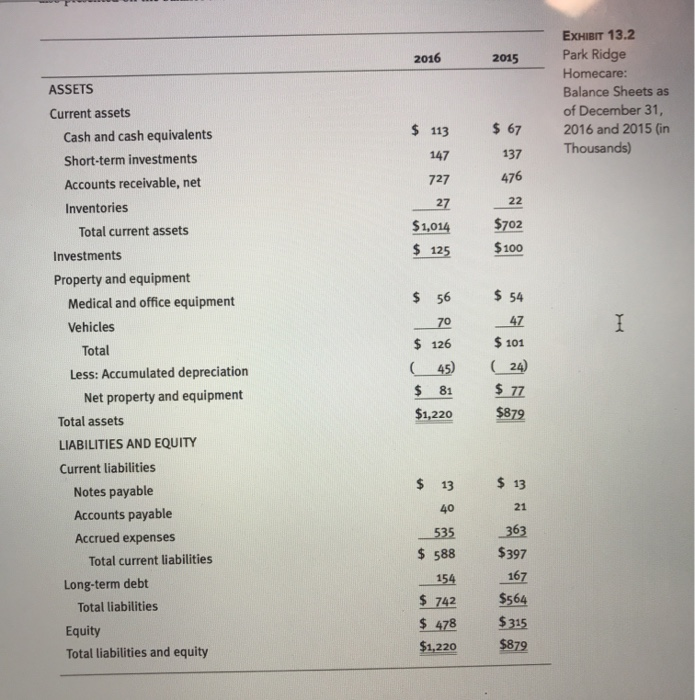
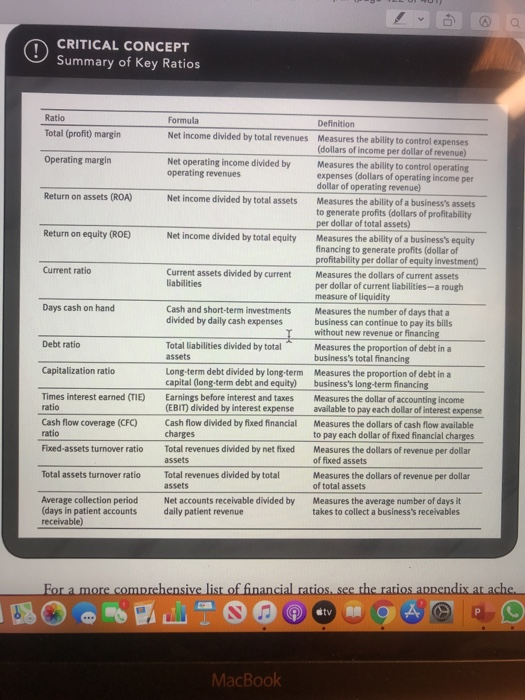
13.3 Park Ridge Homecare's financial statements are presented in exhibits 13.1, 13.2, and 13.3. In the chapter, we calculate selected ratios for 2016. a. Calculate the business's financial ratios for 2015. Assume that Park Ridge had $18,000 in lease payments in 2015. (Use the ratio analysis discussion to iden- tify the applicable ratios.) b. Interpret the ratios. For the analysis, assume that the sector average data pre- sented in the ratio analysis section are valid for 2015, 2016 2015 EXHIBIT 13.1 Park Ridge Homecare: Statements of Cash Flows for Years Ended December 31, 2016 and 2015 (in Thousands) $3,740 (3,694) (16) $2,542 (2,536) 89 $ 119 Cash flows from operating activities: Cash received from services Cash paid to employees and suppliers Interest paid Interest earned Net cash from operations Cash flows from investing activities: Purchase of property and equipment Securities purchases Net cash from investing activities Cash flows from financing activities: Repayment of long-term debt Net cash from financing activities Net increase (decrease) in cash and equivalents Cash and equivalents, beginning of year Cash and equivalents, end of year (35) ($ 19) ( 15) ($ 34 ($ 60) $ 0 $ $ 0 39 $ 67 $ 28 $ 113 $ 67 2016 2015 EXHIBIT 13.2 Park Ridge Homecare: Balance Sheets as of December 31, 2016 and 2015 (in Thousands) $ 67 137 27 476 22 $702 $1,014 $ 125 $100 ASSETS Current assets Cash and cash equivalents Short-term investments Accounts receivable, net Inventories Total current assets Investments Property and equipment Medical and office equipment Vehicles Total Less: Accumulated depreciation Net property and equipment Total assets LIABILITIES AND EQUITY Current liabilities Notes payable Accounts payable Accrued expenses Total current liabilities Long-term debt Total liabilities Equity Total liabilities and equity $ 54 _47 $ 101 ( 24) $ 126 (45) $ 81 $1,220 $ 77 $879 $ 13 $ 13 363 $397 167 535 $ 588 154 $ 742 $ 478 $1,220 $564 $ 315 $879 2015 $2,666 2016 $3.996 2,937 $1,059 909 1,944 $ 722 649 Net service revenues Cost of service revenues Gross profit General and administrative expenses Depreciation Total operating expenses Operating income Interest income EXHIBIT 13.3 Park Ridge Homecare: Statements of Income for Years Ended December 31, 2016 and 2015 (in Thousands) 21 $ 664 $ 58 Interest expense Total interest income, net $ 125 Income before income taxes Income tax expense Net income (excess of revenues over expenses) $ 202 $ 39 $ 163 $ 26 $ 99 CRITICAL CONCEPT Summary of Key Ratios Ratio Total (profit) margin Operating margin Return on assets (ROA) Return on equity (ROE) Current ratio Days cash on hand Formula Definition Net income divided by total revenues Measures the ability to control expenses (dollars of income per dollar of revenue) Net operating income divided by Measures the ability to control operating operating revenues expenses (dollars of operating Income per dollar of operating revenue) Net Income divided by total assets Measures the ability of a business's assets to generate profits (dollars of profitability per dollar of total assets) Net income divided by total equity Measures the ability of a business's equity financing to generate profits (dollar of profitability per dollar of equity investment) Current assets divided by current Measures the dollars of current assets liabilities per dollar of current liabilities-a rough measure of liquidity Cash and short-term investments Measures the number of days that a divided by daily cash expenses business can continue to pay its bills without new revenue or financing Total liabilities divided by total Measures the proportion of debt in a assets business's total financing Long-term debt divided by long-term Measures the proportion of debt in a capital (long-term debt and equity) business's long-term financing Earnings before interest and taxes Measures the dollar of accounting income (EBIT) divided by interest expense available to pay each dollar of interest expense Cash flow divided by fixed financial Measures the dollars of cash flow available charges to pay each dollar of fixed financial charges Total revenues divided by net fixed Measures the dollars of revenue per dollar assets of fixed assets Total revenues divided by total Measures the dollars of revenue per dollar assets of total assets Net accounts receivable divided by Measures the average number of days it daily patient revenue takes to collect a business's receivables Debt ratio Capitalization ratio Times interest earned (TIE) ratio Cash flow coverage (CFC) ratio Fored-assets turnover ratio Total assets turnover ratio Average collection period (days in patient accounts receivable) For a more comprehensive list of financial ratios. see the ratios appendix at ache. MacBook 13.3 Park Ridge Homecare's financial statements are presented in exhibits 13.1, 13.2, and 13.3. In the chapter, we calculate selected ratios for 2016. a. Calculate the business's financial ratios for 2015. Assume that Park Ridge had $18,000 in lease payments in 2015. (Use the ratio analysis discussion to iden- tify the applicable ratios.) b. Interpret the ratios. For the analysis, assume that the sector average data pre- sented in the ratio analysis section are valid for 2015, 2016 2015 EXHIBIT 13.1 Park Ridge Homecare: Statements of Cash Flows for Years Ended December 31, 2016 and 2015 (in Thousands) $3,740 (3,694) (16) $2,542 (2,536) 89 $ 119 Cash flows from operating activities: Cash received from services Cash paid to employees and suppliers Interest paid Interest earned Net cash from operations Cash flows from investing activities: Purchase of property and equipment Securities purchases Net cash from investing activities Cash flows from financing activities: Repayment of long-term debt Net cash from financing activities Net increase (decrease) in cash and equivalents Cash and equivalents, beginning of year Cash and equivalents, end of year (35) ($ 19) ( 15) ($ 34 ($ 60) $ 0 $ $ 0 39 $ 67 $ 28 $ 113 $ 67 2016 2015 EXHIBIT 13.2 Park Ridge Homecare: Balance Sheets as of December 31, 2016 and 2015 (in Thousands) $ 67 137 27 476 22 $702 $1,014 $ 125 $100 ASSETS Current assets Cash and cash equivalents Short-term investments Accounts receivable, net Inventories Total current assets Investments Property and equipment Medical and office equipment Vehicles Total Less: Accumulated depreciation Net property and equipment Total assets LIABILITIES AND EQUITY Current liabilities Notes payable Accounts payable Accrued expenses Total current liabilities Long-term debt Total liabilities Equity Total liabilities and equity $ 54 _47 $ 101 ( 24) $ 126 (45) $ 81 $1,220 $ 77 $879 $ 13 $ 13 363 $397 167 535 $ 588 154 $ 742 $ 478 $1,220 $564 $ 315 $879 2015 $2,666 2016 $3.996 2,937 $1,059 909 1,944 $ 722 649 Net service revenues Cost of service revenues Gross profit General and administrative expenses Depreciation Total operating expenses Operating income Interest income EXHIBIT 13.3 Park Ridge Homecare: Statements of Income for Years Ended December 31, 2016 and 2015 (in Thousands) 21 $ 664 $ 58 Interest expense Total interest income, net $ 125 Income before income taxes Income tax expense Net income (excess of revenues over expenses) $ 202 $ 39 $ 163 $ 26 $ 99 CRITICAL CONCEPT Summary of Key Ratios Ratio Total (profit) margin Operating margin Return on assets (ROA) Return on equity (ROE) Current ratio Days cash on hand Formula Definition Net income divided by total revenues Measures the ability to control expenses (dollars of income per dollar of revenue) Net operating income divided by Measures the ability to control operating operating revenues expenses (dollars of operating Income per dollar of operating revenue) Net Income divided by total assets Measures the ability of a business's assets to generate profits (dollars of profitability per dollar of total assets) Net income divided by total equity Measures the ability of a business's equity financing to generate profits (dollar of profitability per dollar of equity investment) Current assets divided by current Measures the dollars of current assets liabilities per dollar of current liabilities-a rough measure of liquidity Cash and short-term investments Measures the number of days that a divided by daily cash expenses business can continue to pay its bills without new revenue or financing Total liabilities divided by total Measures the proportion of debt in a assets business's total financing Long-term debt divided by long-term Measures the proportion of debt in a capital (long-term debt and equity) business's long-term financing Earnings before interest and taxes Measures the dollar of accounting income (EBIT) divided by interest expense available to pay each dollar of interest expense Cash flow divided by fixed financial Measures the dollars of cash flow available charges to pay each dollar of fixed financial charges Total revenues divided by net fixed Measures the dollars of revenue per dollar assets of fixed assets Total revenues divided by total Measures the dollars of revenue per dollar assets of total assets Net accounts receivable divided by Measures the average number of days it daily patient revenue takes to collect a business's receivables Debt ratio Capitalization ratio Times interest earned (TIE) ratio Cash flow coverage (CFC) ratio Fored-assets turnover ratio Total assets turnover ratio Average collection period (days in patient accounts receivable) For a more comprehensive list of financial ratios. see the ratios appendix at ache. MacBook