Answered step by step
Verified Expert Solution
Question
1 Approved Answer
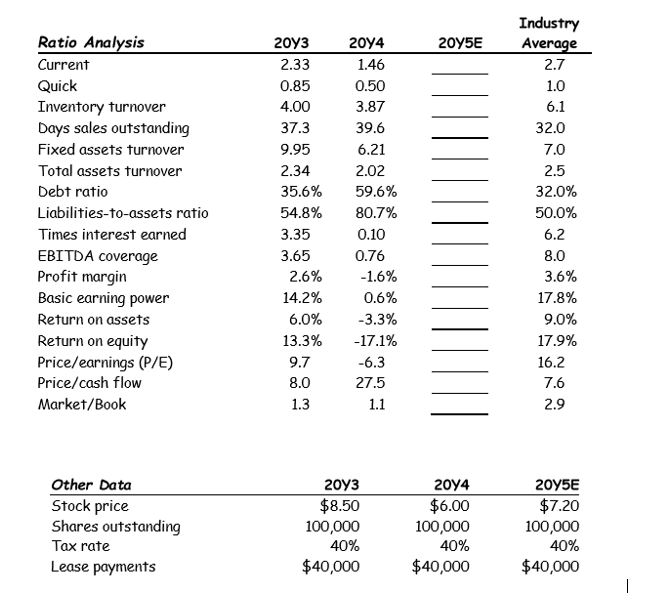
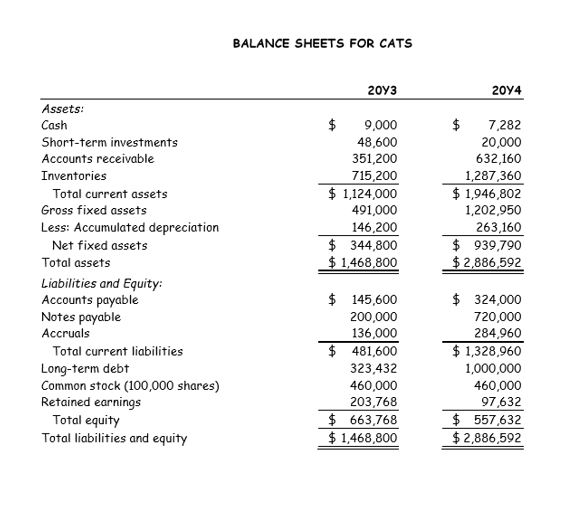
a. Calculate the following liquidity ratios for CATS for F20Y5E: current ratio and quick ratio. What can you say about the companys liquidity position in
a. Calculate the following liquidity ratios for CATS for F20Y5E: current ratio and quick ratio. What can you say about the companys liquidity position in 20Y3, 20Y4, and as projected for 20Y5E? We often think of ratios as being useful: (1) to managers to help run the business, (2) to bankers for credit analysis, and (3) to stockholders for stock valuation. Would these different types of analysts have an equal interest in the liquidity ratios?
Step by Step Solution
There are 3 Steps involved in it
Step: 1

Get Instant Access to Expert-Tailored Solutions
See step-by-step solutions with expert insights and AI powered tools for academic success
Step: 2

Step: 3
Ace Your Homework with AI
Get the answers you need in no time with our AI-driven, step-by-step assistance
Get Started