

Answered step by step
Verified Expert Solution
Question
1 Approved Answer
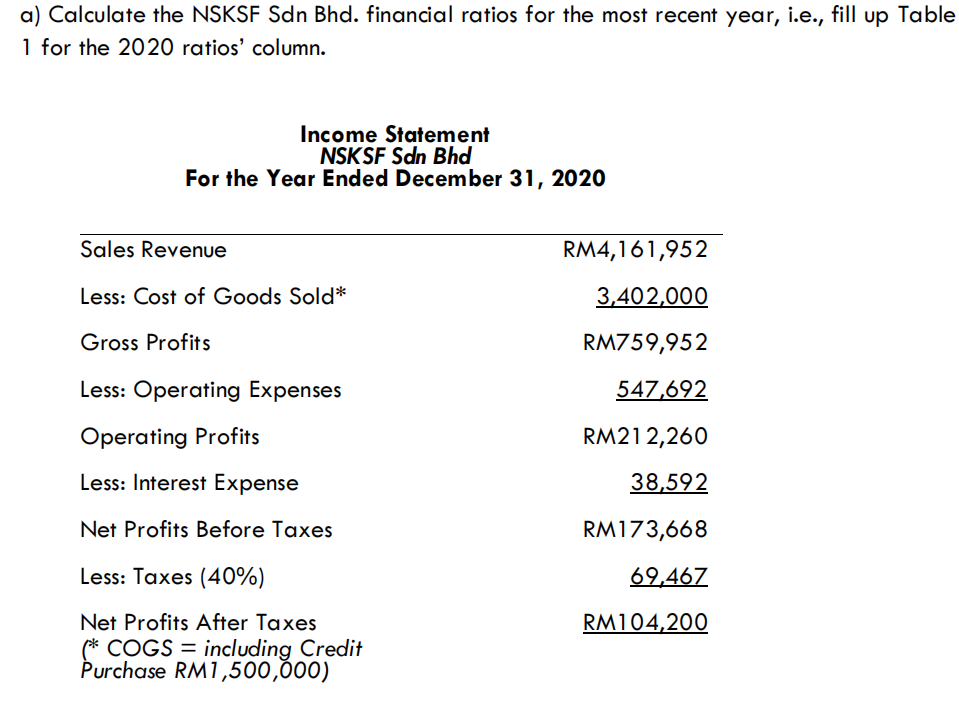
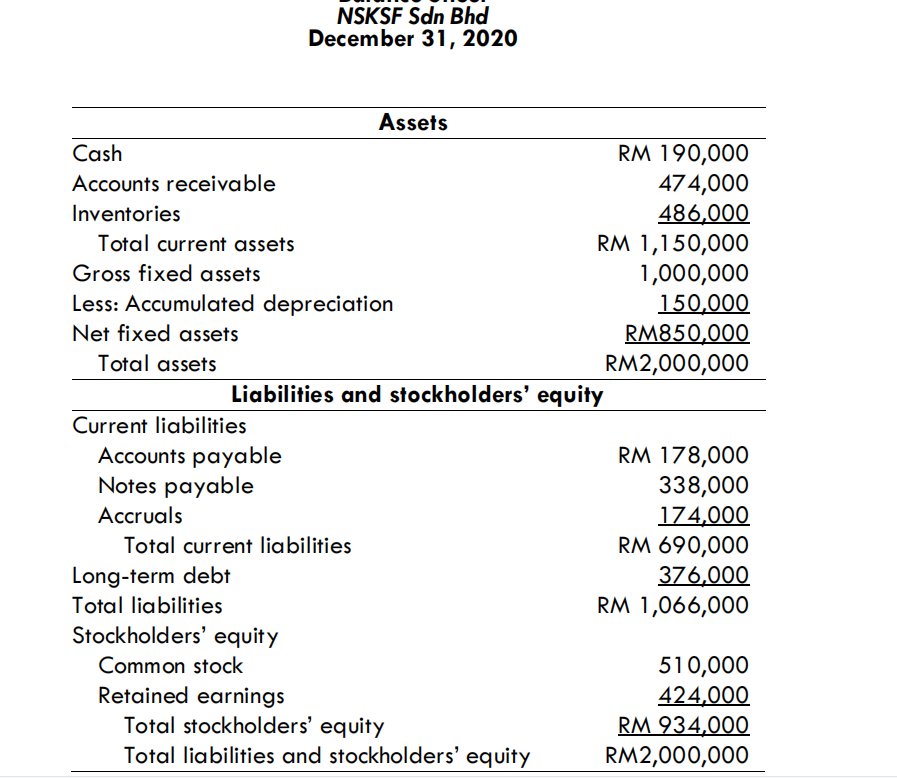
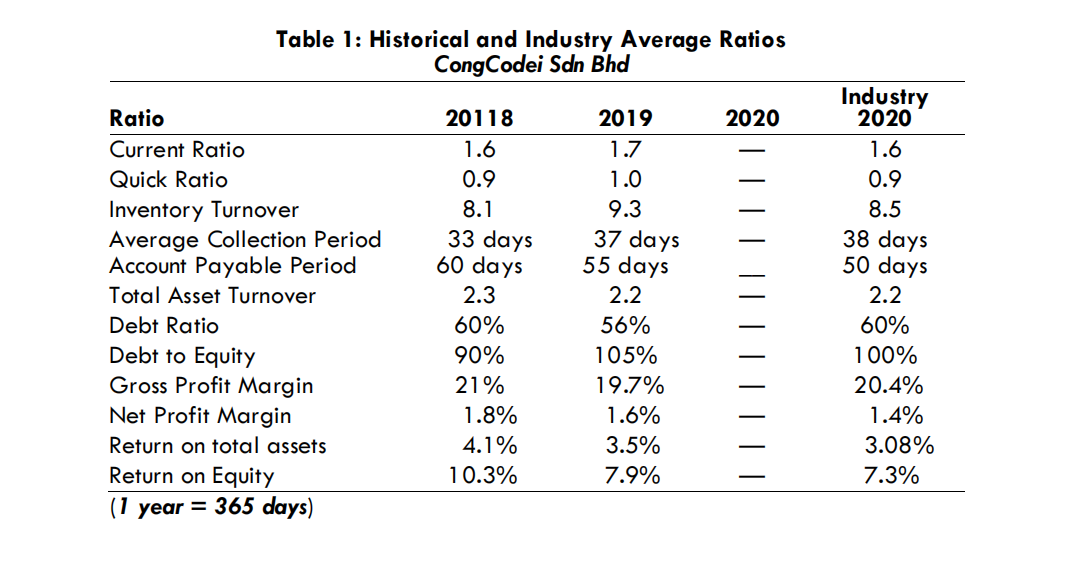
a) Calculate the NSKSF Sdn Bhd. financial ratios for the most recent year, i.e., fill up Table 1 for the 2020 ratios' column. Income Statement

Step by Step Solution
There are 3 Steps involved in it
Step: 1

Get Instant Access to Expert-Tailored Solutions
See step-by-step solutions with expert insights and AI powered tools for academic success
Step: 2

Step: 3
Ace Your Homework with AI
Get the answers you need in no time with our AI-driven, step-by-step assistance
Get Started
Personal Finance For Dummies
Authors: Eric Tyson
5th Edition
0470038322, 978-0470038321