Answered step by step
Verified Expert Solution
Question
1 Approved Answer
A car manufacturer is contemplating the replacement of an old semi-automatic production line with a newer more efficient model; The first alternative is a fully

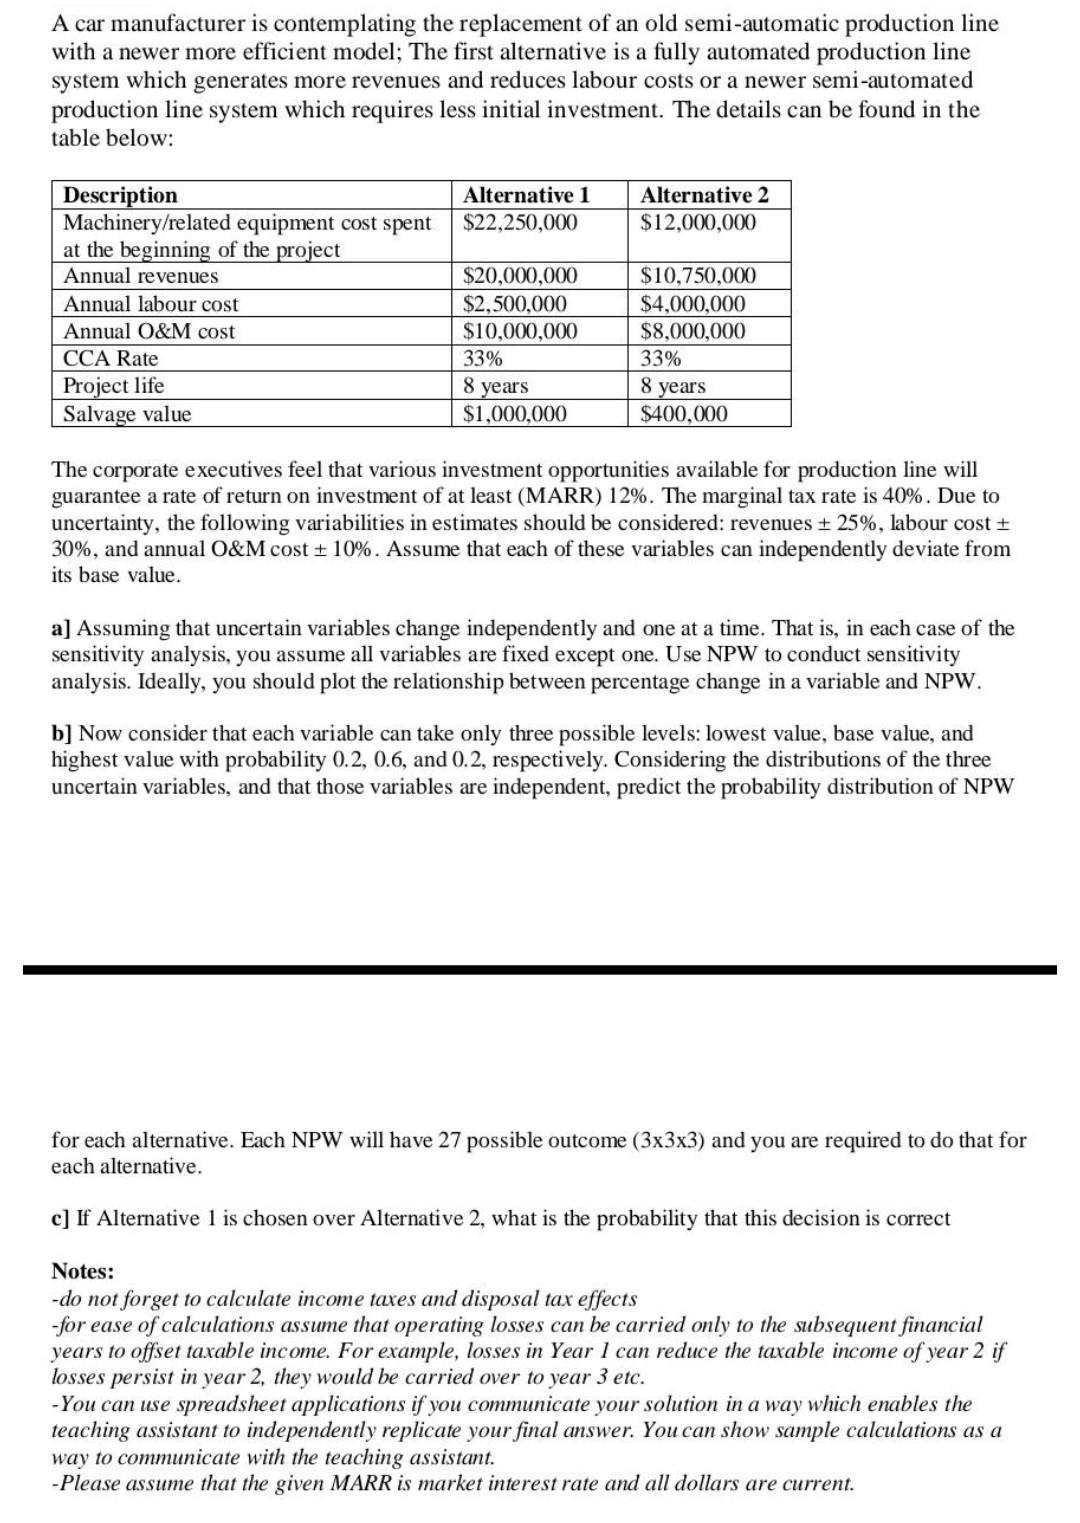
A car manufacturer is contemplating the replacement of an old semi-automatic production line with a newer more efficient model; The first alternative is a fully automated production line system which generates more revenues and reduces labour costs or a newer semi-automated production line system which requires less initial investment. The details can be found in the table below: Alternative 1 $22,250,000 Alternative 2 $12,000,000 Description Machinery/related equipment cost spent at the beginning of the project Annual revenues Annual labour cost Annual O&M cost CCA Rate Project life Salvage value $20,000,000 $2,500,000 $10,000,000 33% $10,750,000 $4,000,000 $8,000,000 33% 8 years 8 years $1,000,000 $400,000 The corporate executives feel that various investment opportunities available for production line will guarantee a rate of return on investment of at least (MARR) 12%. The marginal tax rate is 40%. Due to uncertainty, the following variabilities in estimates should be considered: revenues + 25%, labour cost + 30%, and annual O&M cost + 10%. Assume that each of these variables can independently deviate from its base value. a) Assuming that uncertain variables change independently and one at a time. That is, in each case of the sensitivity analysis, you assume all variables are fixed except one. Use NPW to conduct sensitivity analysis. Ideally, you should plot the relationship between percentage change in a variable and NPW. b] Now consider that each variable can take only three possible levels: lowest value, base value, and highest value with probability 0.2, 0.6, and 0.2, respectively. Considering the distributions of the three uncertain variables, and that those variables are independent, predict the probability distribution of NPW for each alternative. Each NPW will have 27 possible outcome (3x3x3) and you are required to do that for each alternative. c] If Alternative 1 is chosen over Alternative 2, what is the probability that this decision is correct Notes: -do not forget to calculate income taxes and disposal tax effects -for ease of calculations assume that operating losses can be carried only to the subsequent financial years to offset taxable income. For example, losses in Year 1 can reduce the taxable income of year 2 if losses persist in year 2, they would be carried over to year 3 etc. - You can use spreadsheet applications if you communicate your solution in a way which enables the teaching assistant to independently replicate your final answer. You can show sample calculations as a way to communicate with the teaching assistant. - Please assume that the given MARR is market interest rate and all dollars are current A car manufacturer is contemplating the replacement of an old semi-automatic production line with a newer more efficient model; The first alternative is a fully automated production line system which generates more revenues and reduces labour costs or a newer semi-automated production line system which requires less initial investment. The details can be found in the table below: Alternative 1 $22,250,000 Alternative 2 $12,000,000 Description Machinery/related equipment cost spent at the beginning of the project Annual revenues Annual labour cost Annual O&M cost CCA Rate Project life Salvage value $20,000,000 $2,500,000 $10,000,000 33% $10,750,000 $4,000,000 $8,000,000 33% 8 years 8 years $1,000,000 $400,000 The corporate executives feel that various investment opportunities available for production line will guarantee a rate of return on investment of at least (MARR) 12%. The marginal tax rate is 40%. Due to uncertainty, the following variabilities in estimates should be considered: revenues + 25%, labour cost + 30%, and annual O&M cost + 10%. Assume that each of these variables can independently deviate from its base value. a) Assuming that uncertain variables change independently and one at a time. That is, in each case of the sensitivity analysis, you assume all variables are fixed except one. Use NPW to conduct sensitivity analysis. Ideally, you should plot the relationship between percentage change in a variable and NPW. b] Now consider that each variable can take only three possible levels: lowest value, base value, and highest value with probability 0.2, 0.6, and 0.2, respectively. Considering the distributions of the three uncertain variables, and that those variables are independent, predict the probability distribution of NPW for each alternative. Each NPW will have 27 possible outcome (3x3x3) and you are required to do that for each alternative. c] If Alternative 1 is chosen over Alternative 2, what is the probability that this decision is correct Notes: -do not forget to calculate income taxes and disposal tax effects -for ease of calculations assume that operating losses can be carried only to the subsequent financial years to offset taxable income. For example, losses in Year 1 can reduce the taxable income of year 2 if losses persist in year 2, they would be carried over to year 3 etc. - You can use spreadsheet applications if you communicate your solution in a way which enables the teaching assistant to independently replicate your final answer. You can show sample calculations as a way to communicate with the teaching assistant. - Please assume that the given MARR is market interest rate and all dollars are current
Step by Step Solution
There are 3 Steps involved in it
Step: 1

Get Instant Access to Expert-Tailored Solutions
See step-by-step solutions with expert insights and AI powered tools for academic success
Step: 2

Step: 3

Ace Your Homework with AI
Get the answers you need in no time with our AI-driven, step-by-step assistance
Get Started


