Question
A: Carefully review the first sheet (5-31) in the excel file to see what is going on. Notice that this sheet is the same as
A: Carefully review the first sheet (5-31) in the excel file to see what is going on. Notice that this sheet is the same
as some of the stuff on the Practice Problem sheet for this chapter posted in the week 9 folder (there may be slight
differences due to rounding: excel is more precise. (0 points)
Step B: Read the scenario provided by 5-42 in the book, but do not answer the questions the book asks. (0 points)
Step C: Go to the 5-42 sheet and do the following:
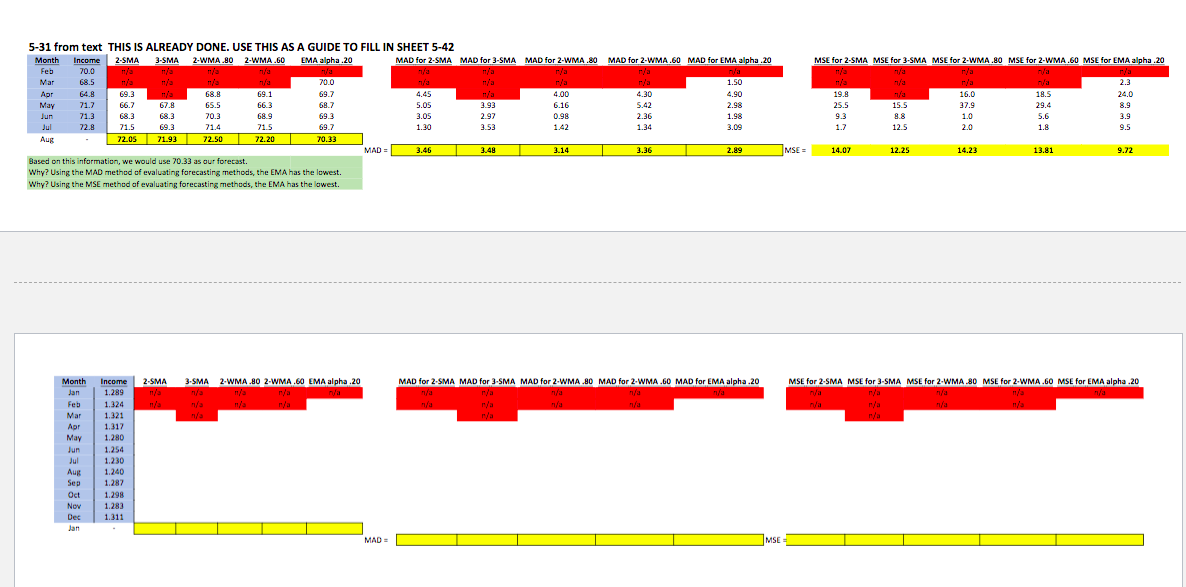
1. Make all of the possible the forecasts using the methods stated (as in Columns C thru G in the 5-31 sheet) (40 points)
2. Calculate the MAD for each forecasting method (as in columns J thru N in the 5-31 sheet) (20 points)
3. Calculate the MSE for each forecasting method (as in columns Q thru U in the 5-31 sheet) (20 points)
4. Which forecast for the exchange rate in January would you give your boss and why? (20 points)
Answer this question in the excel sheet (see 5-31 for something similar in rows 14 through 16)
for 2-WMA.60 MAD for EMA alpha .20 MSE for 2-SMA MSE for 3-SMA MSE for 2-WMA.80 MSE for 2-WMA.60 MSE for EMA alpha .20 n/a 68.5 649 68.8 4.00 4.30 4.90 n/a 16.0 185 19.8 25.5 24.0 3.93 6.16 5.42 2.98 15.5 37.9 29.4 5-31 from text THIS IS ALREADY DONE. USE THIS AS A GUIDE TO FILL IN SHEET 5-42 Month Income 2-SMA 3-SMA 2-WMA.80 2-WMA.60 EMA alpha.20 MAD for 2-SMA MAD for 3-SMA Feb 70.0 n/a Mar 70.0 69.3 69.1 69.7 n'a May 71.7 66.7 67.8 65.5 66.3 68.7 5.05 Jun 71.3 68.3 68.3 20.3 69.3 2.97 Jul 22.8 69.7 22.05 2 1.93 72.50 72.20 MAD = 3.46 3.48 Based on this information, we would use 70.33 as our forecast. Why? Using the MAD method of evaluating forecasting methods, the EMA has the lowest Why? Using the MSE method of evaluating forecasting methods, the EMA has the lowest. 3.05 0.98 1.98 689 715 2.36 1.34 71.4 1.30 1.42 12.5 1.8 Aur 70.33 3.14 3.36 2. 89 M SE = 14.07 12.25 14.23 13.81 9.72 Month 2.SMA MAD for 2-SMA MAD for 3-SMA MAD for 2-WMA.80 MAD for 2-WMA.60 MAD for EMA alpha.20 MSE for 2-SMA MSE for 3-SMA MSE for 2-WMA.80 MSE for 2-WMA,60 MSE for EMA alpha 20 Jan income 1.289 1.324 3-SMA 2-WMA .80 2-WMA.60 EMA alpha .20 n/a n/a n/a Feb n/a 1321 n/a n/a Apr May 1.317 1.280 1.254 Aug 1.230 1.240 1.287 1.298 1.282 1311 NON Des MADE for 2-WMA.60 MAD for EMA alpha .20 MSE for 2-SMA MSE for 3-SMA MSE for 2-WMA.80 MSE for 2-WMA.60 MSE for EMA alpha .20 n/a 68.5 649 68.8 4.00 4.30 4.90 n/a 16.0 185 19.8 25.5 24.0 3.93 6.16 5.42 2.98 15.5 37.9 29.4 5-31 from text THIS IS ALREADY DONE. USE THIS AS A GUIDE TO FILL IN SHEET 5-42 Month Income 2-SMA 3-SMA 2-WMA.80 2-WMA.60 EMA alpha.20 MAD for 2-SMA MAD for 3-SMA Feb 70.0 n/a Mar 70.0 69.3 69.1 69.7 n'a May 71.7 66.7 67.8 65.5 66.3 68.7 5.05 Jun 71.3 68.3 68.3 20.3 69.3 2.97 Jul 22.8 69.7 22.05 2 1.93 72.50 72.20 MAD = 3.46 3.48 Based on this information, we would use 70.33 as our forecast. Why? Using the MAD method of evaluating forecasting methods, the EMA has the lowest Why? Using the MSE method of evaluating forecasting methods, the EMA has the lowest. 3.05 0.98 1.98 689 715 2.36 1.34 71.4 1.30 1.42 12.5 1.8 Aur 70.33 3.14 3.36 2. 89 M SE = 14.07 12.25 14.23 13.81 9.72 Month 2.SMA MAD for 2-SMA MAD for 3-SMA MAD for 2-WMA.80 MAD for 2-WMA.60 MAD for EMA alpha.20 MSE for 2-SMA MSE for 3-SMA MSE for 2-WMA.80 MSE for 2-WMA,60 MSE for EMA alpha 20 Jan income 1.289 1.324 3-SMA 2-WMA .80 2-WMA.60 EMA alpha .20 n/a n/a n/a Feb n/a 1321 n/a n/a Apr May 1.317 1.280 1.254 Aug 1.230 1.240 1.287 1.298 1.282 1311 NON Des MADE
Step by Step Solution
There are 3 Steps involved in it
Step: 1
Get Instant Access to Expert-Tailored Solutions
See step-by-step solutions with expert insights and AI powered tools for academic success
Step: 2
Step: 3
Ace Your Homework with AI
Get the answers you need in no time with our AI-driven, step-by-step assistance
Get Started