Answered step by step
Verified Expert Solution
Question
1 Approved Answer
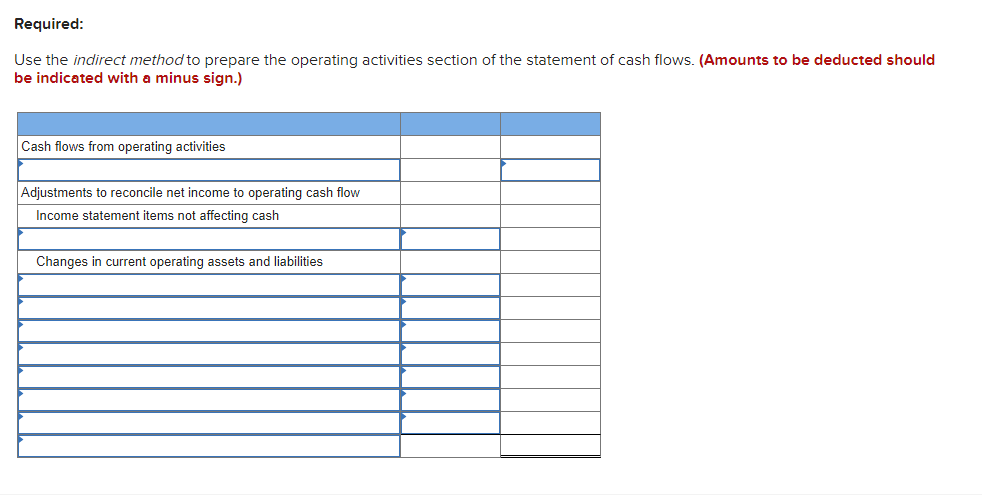
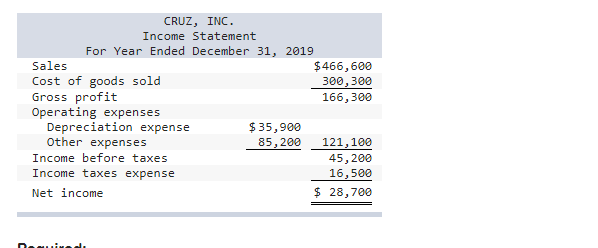
A comparative balance sheet and income statement is shown for Cruz, Inc. CRUZ, INC. Comparative Balance Sheets December 31, 2019 2019 2018 $ 90,700 38,900
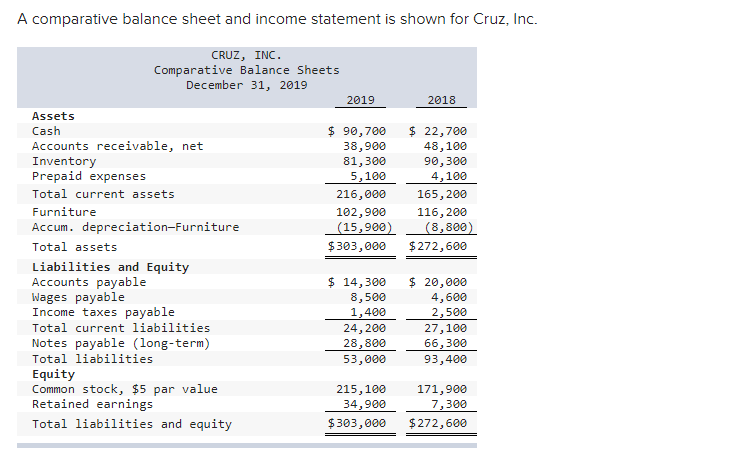
A comparative balance sheet and income statement is shown for Cruz, Inc. CRUZ, INC. Comparative Balance Sheets December 31, 2019 2019 2018 $ 90,700 38,900 81,300 5,100 216,000 102,900 (15,900) $303,000 $ 22,700 48,100 90,300 4,100 165,200 116, 200 (8,800) $ 272,600 Assets Cash Accounts receivable, net Inventory Prepaid expenses Total current assets Furniture Accum. depreciation-Furniture Total assets Liabilities and Equity Accounts payable Wages payable Income taxes payable Total current liabilities Notes payable (long-term) Total liabilities Equity Common stock, $5 par value Retained earnings Total liabilities and equity $ 14,300 8,500 1,400 24,200 28,800 53,000 $ 20,000 4,600 2,500 27,100 66,300 93,400 215,100 34,900 $303,000 171,900 7,300 $ 272,600 CRUZ, INC. Income Statement For Year Ended December 31, 2019 Sales $466,600 Cost of goods sold 300,300 Gross profit 166,300 Operating expenses Depreciation expense $ 35,900 Other expenses 85,200 121,100 Income before taxes 45,200 Income taxes expense 16,500 Net income $ 28,700 Required: Use the indirect method to prepare the operating activities section of the statement of cash flows. (Amounts to be deducted should be indicated with a minus sign.) Cash flows from operating activities Adjustments to reconcile net income to operating cash flow Income statement items not affecting cash Changes in current operating assets and liabilities
Step by Step Solution
There are 3 Steps involved in it
Step: 1
Get Instant Access to Expert-Tailored Solutions
See step-by-step solutions with expert insights and AI powered tools for academic success
Step: 2
Step: 3
Ace Your Homework with AI
Get the answers you need in no time with our AI-driven, step-by-step assistance
Get Started