Question
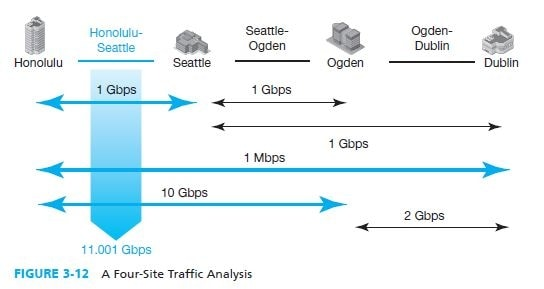
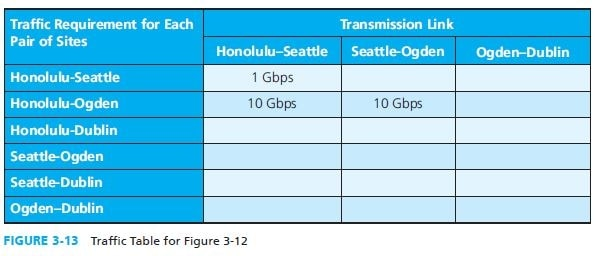
a) Complete the traffic table in Figure 3-13. b) In Figure 3-12, add 392 Mbps of traffic for Seattle-Ogden communication. Using a picture like the
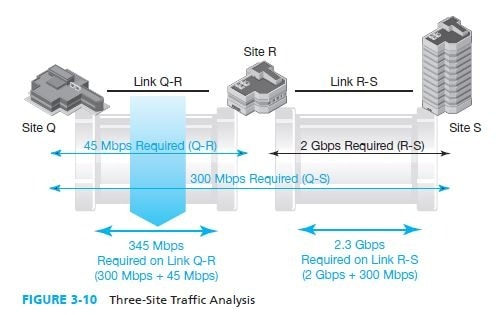
a) Complete the traffic table in Figure 3-13. b) In Figure 3-12, add 392 Mbps of traffic for Seattle-Ogden communication. Using a picture like the one in the figure, show your work. c) Do it again with a traffic table. d) In Figure 3-10, remove the link between Q and R but add a link between Q and S. Using a picture, calculate requirements, showing your work. (Do not add the 392 Mbps in Part a.) e) Now use a traffic table to do the calculations. f) If you have 10 sites connected by seven transmission links, how many rows of traffic data will you have in your traffic table? g) How many columns?


Step by Step Solution
There are 3 Steps involved in it
Step: 1

Get Instant Access to Expert-Tailored Solutions
See step-by-step solutions with expert insights and AI powered tools for academic success
Step: 2

Step: 3

Ace Your Homework with AI
Get the answers you need in no time with our AI-driven, step-by-step assistance
Get Started


