Answered step by step
Verified Expert Solution
Question
1 Approved Answer
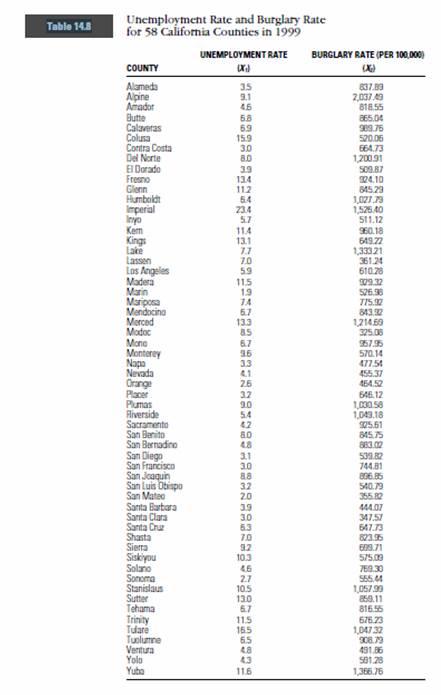
a. Compute Spearmans r for these data. b. How does the value of Pearsons r compare to that for Spearmans r? What might account for

a. Compute Spearmans r for these data.
b. How does the value of Pearsons r compare to that for Spearmans r? What might account for this?
c. Generate a scatterplot for these data.
Table 14.8 Unemployment Rate and Burglary Rate for 58 California Counties in 1999 COUNTY UNEMPLOYMENT RATE (X2) BURGLARY RATE (PER 100,000) (X) Alameda 35 837.89 Alpine 9.1 2,037.49 Amador 46 818.55 Butte 65 865.04 Calaveras 69 989.75 Colina 15.9 520.06 Contra Costa 3.0 664.73 Del Norte 8.0 1,200.91 El Dorado 39 509.87 Fresno 134 924.10 Glenn 112 845.29 Humboldt 54 1,027.79 Imperial 23.4 1,526.40 Inyo 5.7 511.12 Kem Kings 11.4 960.18 13.1 649.22 Lake 7.7 1,333.21 Lassen 7.0 361.24 Los Angeles 59 610.28 Madera 11.5 909.32 Marin 1.9 526.96 Mariposa 14 775.90 Mendocina 57 843.32 Merced 13.3 1,214.69 Modoc 85 325.06 Mono 6.7 957.95 Monterey 96 570.14 Napa 3.3 477.54 Nevada 4.1 455.37 Orange 2.6 464.52 Placer 32 646.12 Plumas 20 1,000 58 Riverside 54 1,043.18 Sacramento 42 925.61 San Benito 80 845.75 San Bernadino 48 883.02 San Diego 3.1 539.82 San Francisco 30 744.81 San Joaquin 88 806.85 San Luis Obispo 32 540.79 San Mateo 20 355.82 Santa Barbara 3.9 444.07 Santa Clara 30 347.51 Santa Cruz Shasta 6.3 647.73 7.0 823.95 Sierra 92 603.71 Siskiyou 10.3 575.00 Solano 46 769.30 Sonoma 2.7 555.44 Stanislaus 10.5 1,057.99 Sutter 13.0 859.11 Tehama 67 816.55 Trinity 11.5 676.23 Tulare 165 1,04732 Tuolumne 6.5 908.79 Ventura 48 491.86 Yolo 43 581.28 Yubo 11.6 1,366.76
Step by Step Solution
There are 3 Steps involved in it
Step: 1

Get Instant Access to Expert-Tailored Solutions
See step-by-step solutions with expert insights and AI powered tools for academic success
Step: 2

Step: 3

Ace Your Homework with AI
Get the answers you need in no time with our AI-driven, step-by-step assistance
Get Started


