Answered step by step
Verified Expert Solution
Question
1 Approved Answer
Listed in the diagram for Problem 7 are some probability estimates of the costs and benefits associated with two competing projects. a. Compute the net
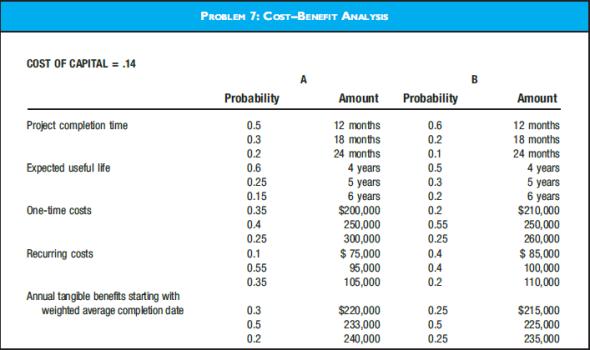
Listed in the diagram for Problem 7 are some probability estimates of the costs and benefits associated with two competing projects.
a. Compute the net present value of each alternative. Round the cost projections to the nearest month.
b. Repeat step (a) for the payback method.
c. Which method do you think provides the best source of information? Why?

PROBLEM 7: CosT-BENEIT ANALYSIS COST OF CAPITAL = .14 Probability Amount Probability Amount Project completion time 0.5 12 months 0.6 12 months 0.2 0.1 0.3 18 months 18 months 0.2 24 months 24 months Expected useful life 0.6 4 years 5 years 6 years $200,000 250,000 300,000 $ 75,000 95,000 105,000 0.5 0.3 0.2 4 years 5 years 6 years $210,000 250,000 260,000 $ 85,000 100,000 110,000 0.25 0.15 One-time costs 0.35 0.2 0.4 0.55 0.25 0.1 0.55 0.25 Recurring costs 0.4 0.4 0.35 0.2 Annual tangble benefts starting with weighted average completion date $220,000 233,000 240,000 0.3 0.25 $215,000 225,000 235,000 0.5 0.5 0.2 0.25
Step by Step Solution
★★★★★
3.32 Rating (167 Votes )
There are 3 Steps involved in it
Step: 1
Step 1 of 3 A CostBenefit Analysis NPV NPV is calculated for the recurring cost according to the pro...
Get Instant Access to Expert-Tailored Solutions
See step-by-step solutions with expert insights and AI powered tools for academic success
Step: 2

Step: 3

Ace Your Homework with AI
Get the answers you need in no time with our AI-driven, step-by-step assistance
Get Started


