Answered step by step
Verified Expert Solution
Question
1 Approved Answer
(a) Consider the following scenario: Day 2 VIZI/ fubd cost $1000 3 400 report date 4 460 5 400 Figure: GANTT Chart for an

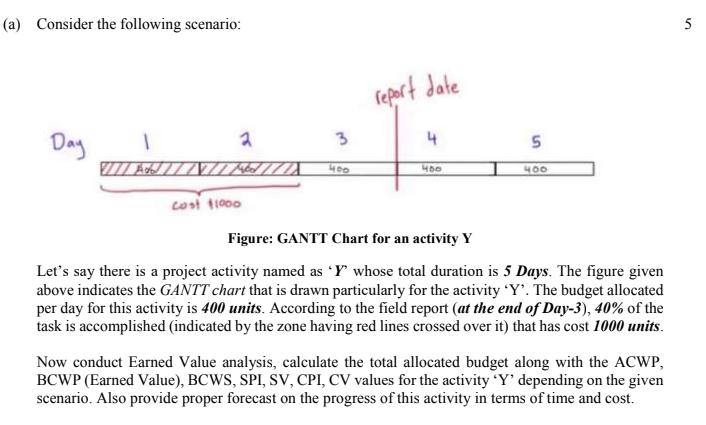
(a) Consider the following scenario: Day 2 VIZI/ fubd cost $1000 3 400 report date 4 460 5 400 Figure: GANTT Chart for an activity Y Let's say there is a project activity named as 'Y' whose total duration is 5 Days. The figure given above indicates the GANTT chart that is drawn particularly for the activity 'Y'. The budget allocated per day for this activity is 400 units. According to the field report (at the end of Day-3), 40% of the task is accomplished (indicated by the zone having red lines crossed over it) that has cost 1000 units. Now conduct Earned Value analysis, calculate the total allocated budget along with the ACWP, BCWP (Earned Value), BCWS, SPI, SV, CPI, CV values for the activity 'Y' depending on the given scenario. Also provide proper forecast on the progress of this activity in terms of time and cost. 5
Step by Step Solution
There are 3 Steps involved in it
Step: 1
The provided image contains a GANTT chart for a project activity named Y which has a total duration of 5 days According to the details given the budget assigned per day for this activity is 400 units ...
Get Instant Access to Expert-Tailored Solutions
See step-by-step solutions with expert insights and AI powered tools for academic success
Step: 2

Step: 3

Ace Your Homework with AI
Get the answers you need in no time with our AI-driven, step-by-step assistance
Get Started


