

Answered step by step
Verified Expert Solution
Question
1 Approved Answer
(a) Construct a time series plot. What type of pattern exists in the data? The time series plot shows a nonlinear trend. The time series
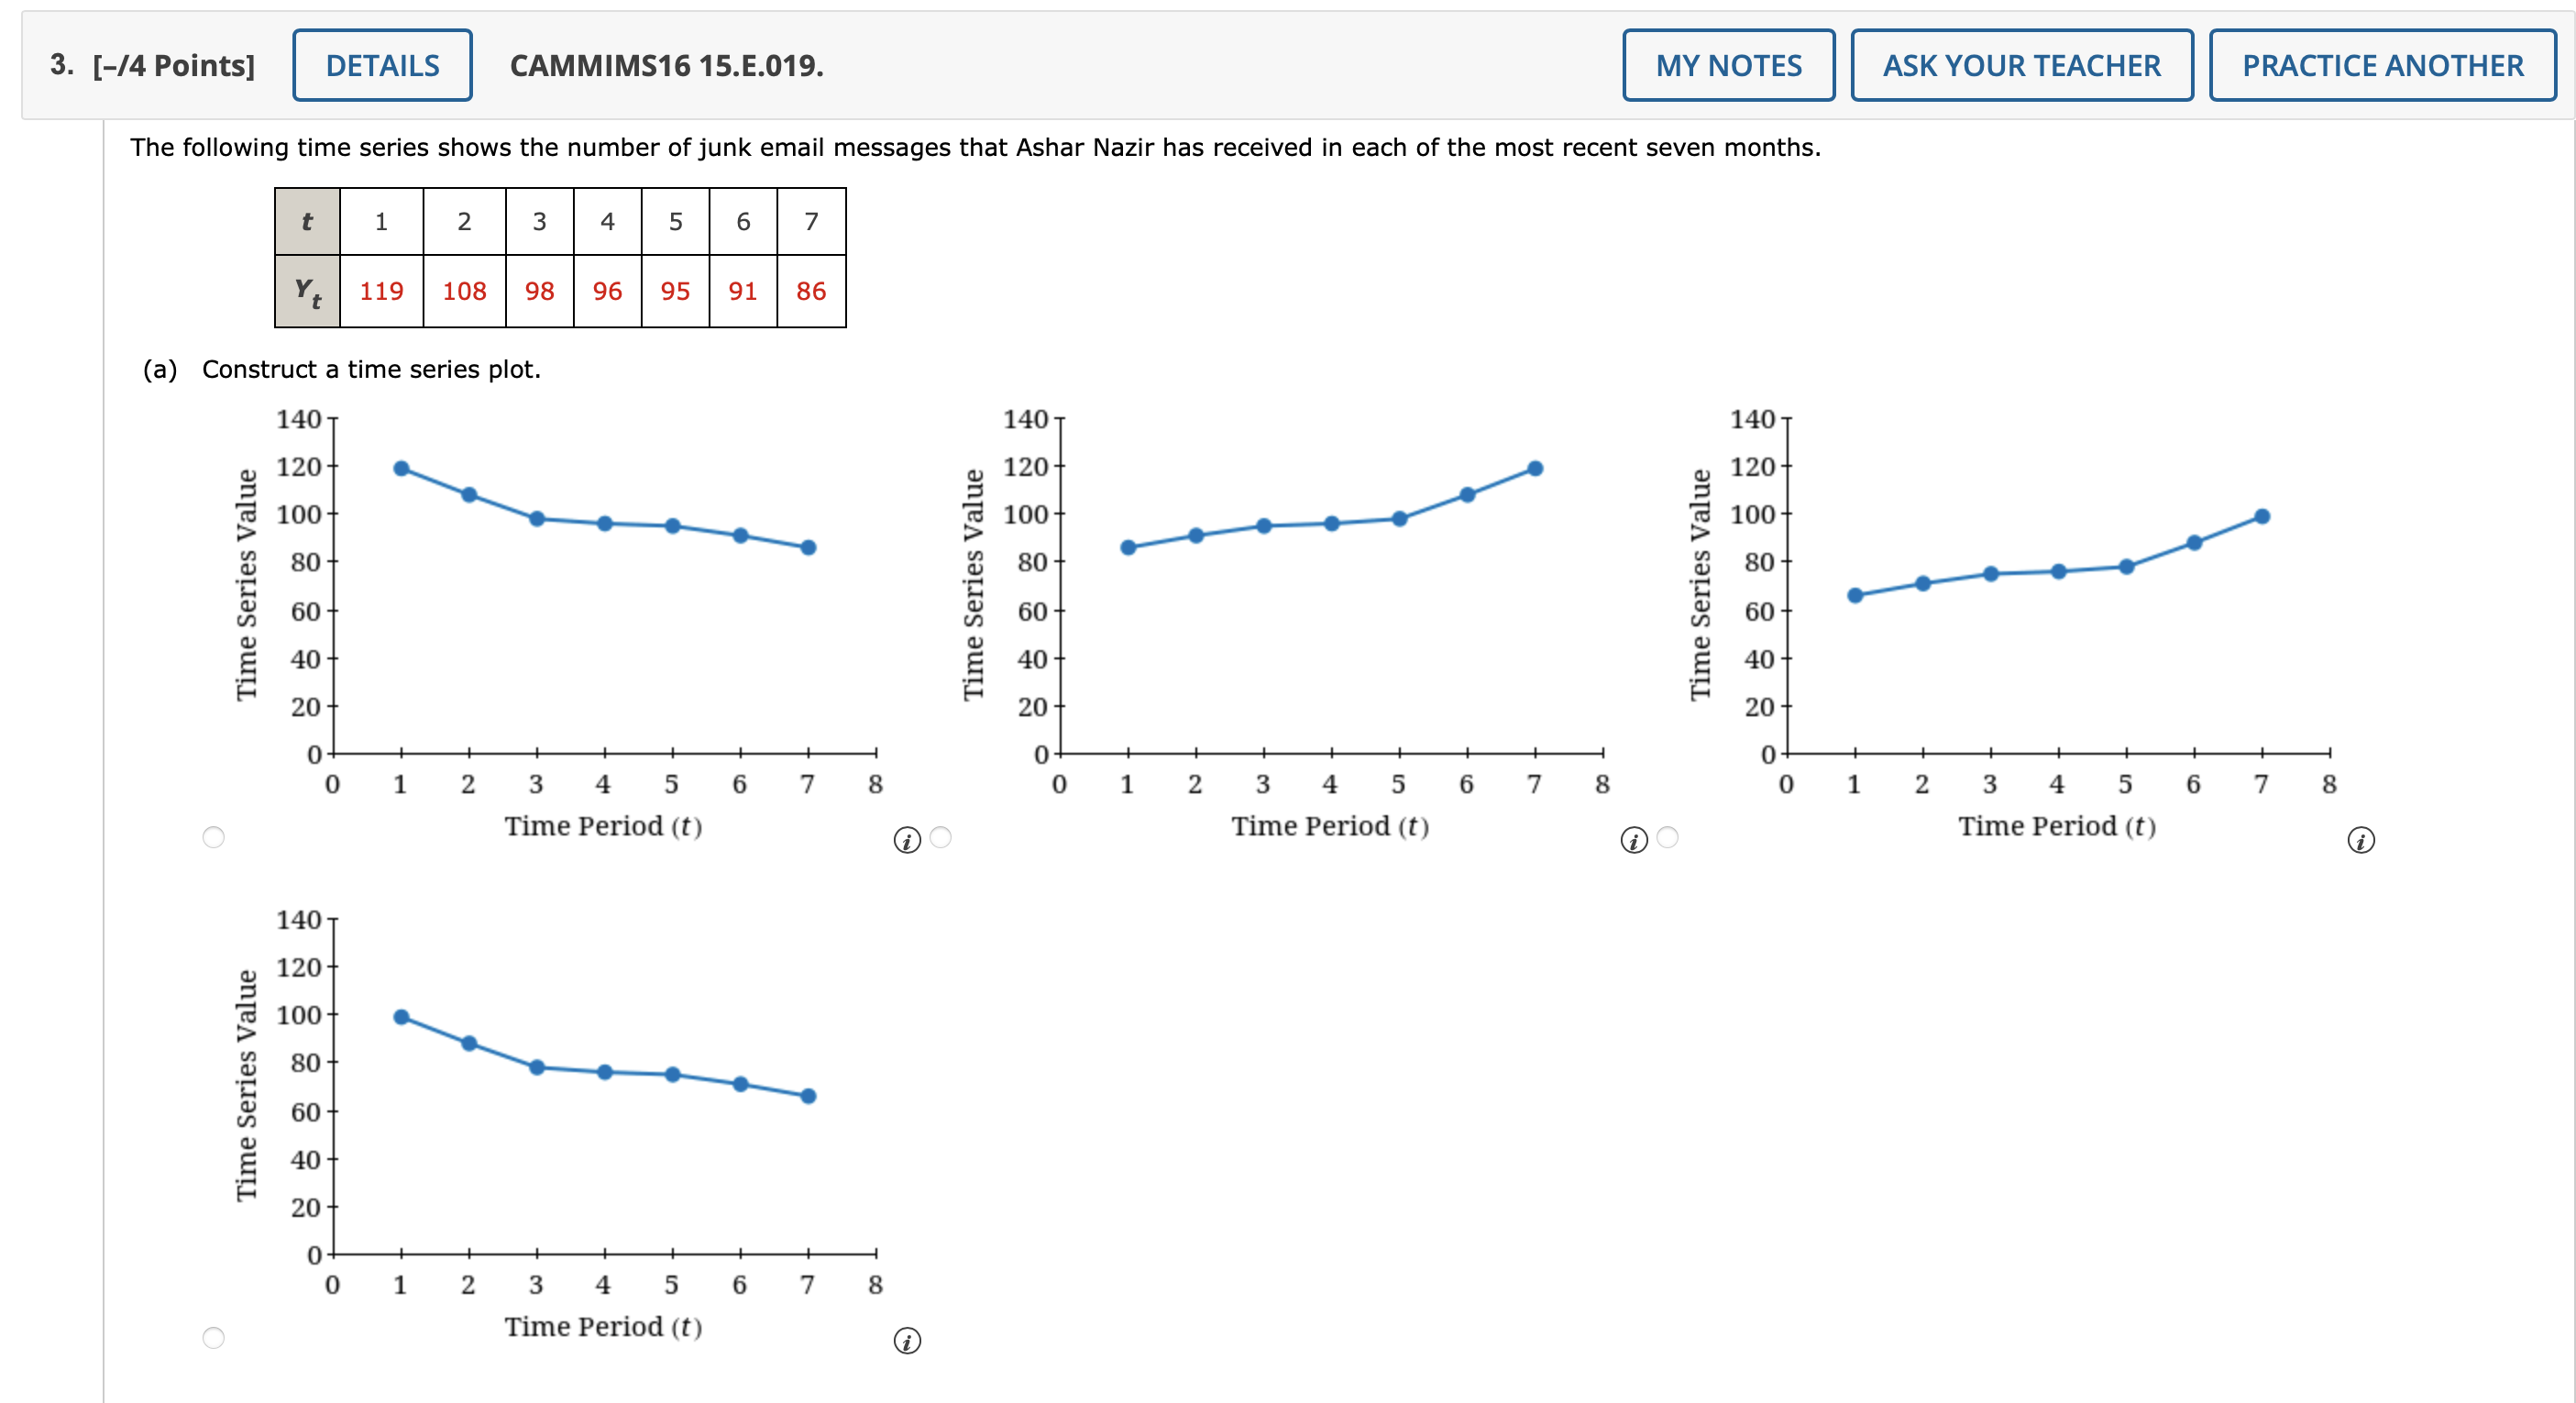
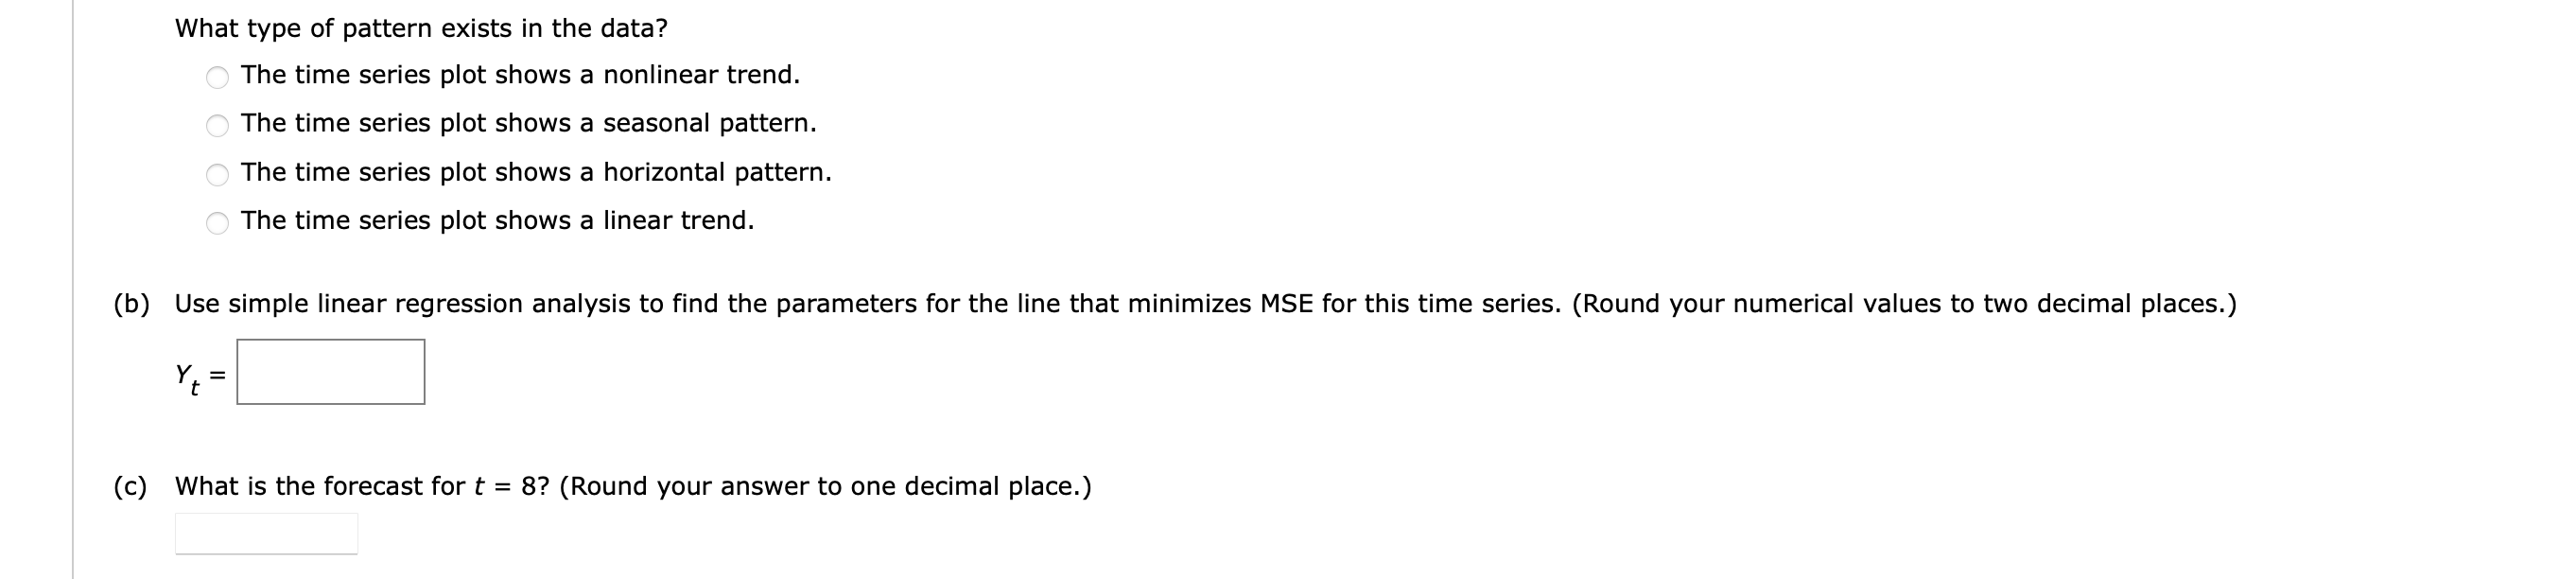 (a) Construct a time series plot. What type of pattern exists in the data? The time series plot shows a nonlinear trend. The time series plot shows a seasonal pattern. The time series plot shows a horizontal pattern. The time series plot shows a linear trend. (b) Use simple linear regression analysis to find the parameters for the line that minimizes MSE for this time series. (Round your numerical values to two decimal places.) Yt= (c) What is the forecast for t=8 ? (Round your answer to one decimal place.)
 Step by Step Solution
There are 3 Steps involved in it
Step: 1

Get Instant Access to Expert-Tailored Solutions
See step-by-step solutions with expert insights and AI powered tools for academic success
Step: 2

Step: 3
Ace Your Homework with AI
Get the answers you need in no time with our AI-driven, step-by-step assistance
Get Started
Financial Markets And Institutions
Authors: Jeff Madura
9th Edition
1439038848, 978-1439038840