

Answered step by step
Verified Expert Solution
Question
1 Approved Answer
a. Construct two exponentially smoothed series for this time series, using w=.1 and w = .9. b. Plot the original series and the two
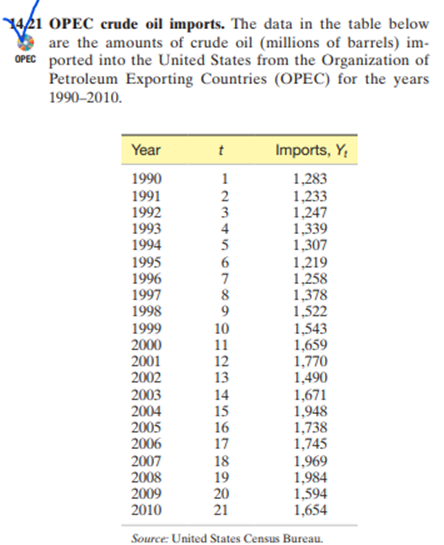
a. Construct two exponentially smoothed series for this time series, using w=.1 and w = .9. b. Plot the original series and the two smoothed series on the same graph. Which smoothed series looks more like the original series? Why? 14/21 OPEC crude oil imports. The data in the table below are the amounts of crude oil (millions of barrels) im- OPEC ported into the United States from the Organization of Petroleum Exporting Countries (OPEC) for the years 1990-2010. Year t Imports, Y 1990 1 1,283 1991 1992 1993 1994 1995 1996 1997 1998 123456789 1,233 1,247 1,339 1,307 1,219 1,258 1,378 9 1,522 1999 10 1,543 2000 11 1,659 2001 12 1,770 2002 13 1,490 2003 14 1,671 2004 15 1,948 2005 16 1,738 2006 17 1,745 2007 18 1,969 2008 19 1,984 2009 20 1,594 2010 21 1,654 Source: United States Census Bureau.
Step by Step Solution
There are 3 Steps involved in it
Step: 1

Get Instant Access to Expert-Tailored Solutions
See step-by-step solutions with expert insights and AI powered tools for academic success
Step: 2

Step: 3
Ace Your Homework with AI
Get the answers you need in no time with our AI-driven, step-by-step assistance
Get Started
Statistics For Business And Economics
Authors: James T. McClave, P. George Benson, Terry Sincich
13th Edition
134506596, 978-0134506593