Create an exploded pie chart object. Use Chart Tools command tabs. Edit the data source. An exploded pie chart shows one or more of

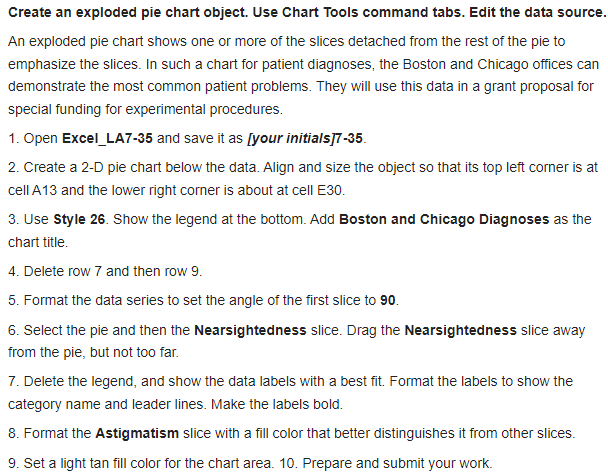
Create an exploded pie chart object. Use Chart Tools command tabs. Edit the data source. An exploded pie chart shows one or more of the slices detached from the rest of the pie to emphasize the slices. In such a chart for patient diagnoses, the Boston and Chicago offices can demonstrate the most common patient problems. They will use this data in a grant proposal for special funding for experimental procedures. 1. Open Excel_LA7-35 and save it as [your initials]7-35. 2. Create a 2-D pie chart below the data. Align and size the object so that its top left corner is at cell A13 and the lower right corner is about at cell E30. 3. Use Style 26. Show the legend at the bottom. Add Boston and Chicago Diagnoses as the chart title. 4. Delete row 7 and then row 9. 5. Format the data series to set the angle of the first slice to 90. 6. Select the pie and then the Nearsightedness slice. Drag the Nearsightedness slice away from the pie, but not too far. 7. Delete the legend, and show the data labels with a best fit. Format the labels to show the category name and leader lines. Make the labels bold. 8. Format the Astigmatism slice with a fill color that better distinguishes it from other slices. 9. Set a light tan fill color for the chart area. 10. Prepare and submit your work.
Step by Step Solution
3.52 Rating (152 Votes )
There are 3 Steps involved in it
Step: 1
step 1 Step 2 Step 3 Step 4 Step 5 step 6 Ste...
See step-by-step solutions with expert insights and AI powered tools for academic success
Step: 2

Step: 3

Ace Your Homework with AI
Get the answers you need in no time with our AI-driven, step-by-step assistance
Get Started


