

Question
A cubic Bezier curve is specified with the following control points: (0, 0), (0, 0.5), (1, 0.5), (1, 1). Generate the following 2D shape
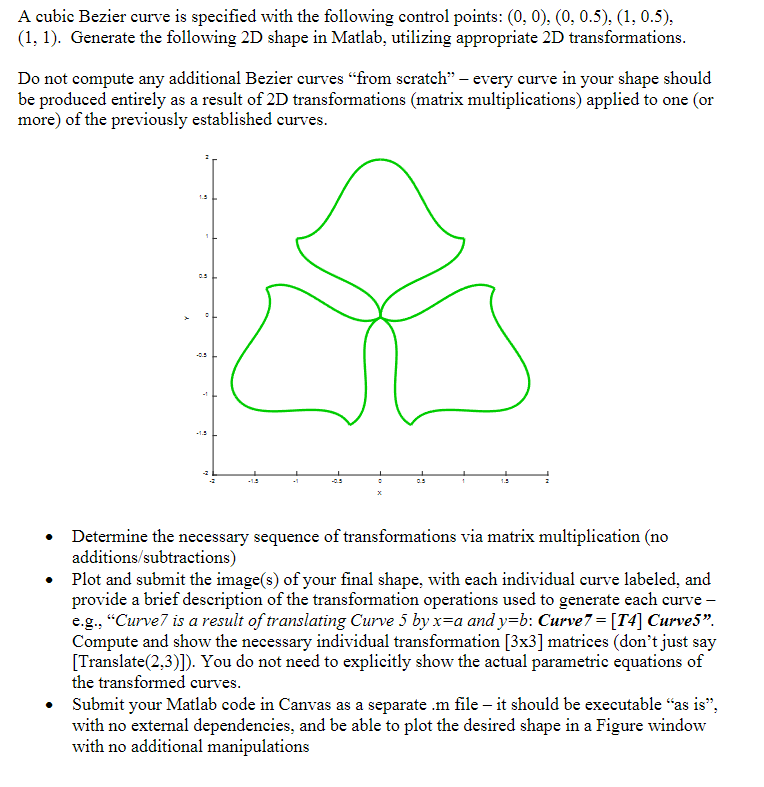
A cubic Bezier curve is specified with the following control points: (0, 0), (0, 0.5), (1, 0.5), (1, 1). Generate the following 2D shape in Matlab, utilizing appropriate 2D transformations. Do not compute any additional Bezier curves "from scratch" - every curve in your shape should be produced entirely as a result of 2D transformations (matrix multiplications) applied to one (or more) of the previously established curves. A 0.5 - 0.5 Determine the necessary sequence of transformations via matrix multiplication (no additions/subtractions) Plot and submit the image(s) of your final shape, with each individual curve labeled, and provide a brief description of the transformation operations used to generate each curve - e.g., "Curve7 is a result of translating Curve 5 by x=a and y=b: Curve7 = [T4] Curve5". Compute and show the necessary individual transformation [3x3] matrices (don't just say [Translate(2,3)]). You do not need to explicitly show the actual parametric equations of the transformed curves. Submit your Matlab code in Canvas as a separate .m file - it should be executable "as is", with no external dependencies, and be able to plot the desired shape in a Figure window with no additional manipulations
Step by Step Solution
There are 3 Steps involved in it
Step: 1
To generate the required 2D shape we will first plot the given cubic Bezier curve with control point...
Get Instant Access to Expert-Tailored Solutions
See step-by-step solutions with expert insights and AI powered tools for academic success
Step: 2

Step: 3
Ace Your Homework with AI
Get the answers you need in no time with our AI-driven, step-by-step assistance
Get Started
Vector Mechanics for Engineers Statics and Dynamics
Authors: Ferdinand Beer, E. Russell Johnston, Jr., Elliot Eisenberg, William Clausen, David Mazurek, Phillip Cornwell
8th Edition
73212229, 978-0073212227