| a Customer service values are based on reduced costs of handling customer complaint phone calls. | | |
| b An important yet intangible benefit will be the ability to offer services that our competitors currently offer. | | |
| | | | | | | | | | |
| | a) | Compute ROI for this project. Put your computing formula in the yellow cell J30. | | |
| | b) | Compute the Breakeven point. Put your computing formula in the yellow cell J31. | | |
| | c) | Compute the Present value of total costs. Put your proper comuting formulas in the cells F33:J33. | |
| | d) | Compute the NPV. Put your proper computing formula in the cell J34. | | | |
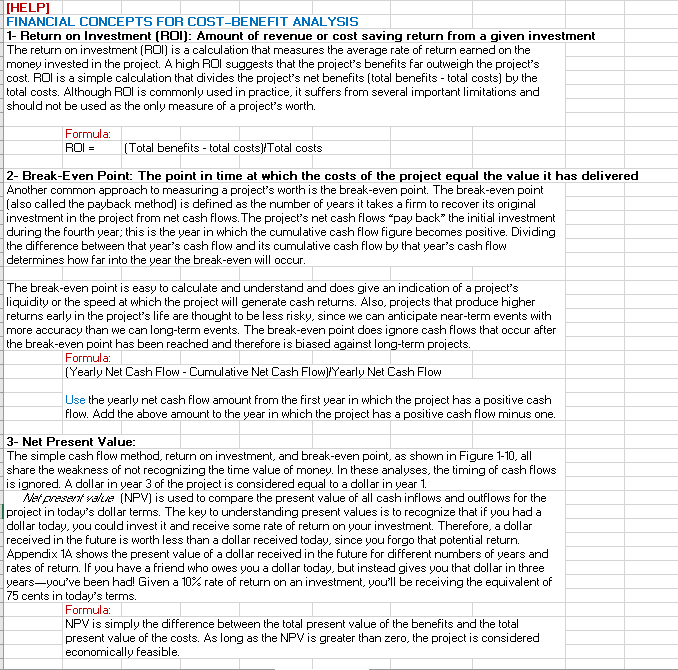
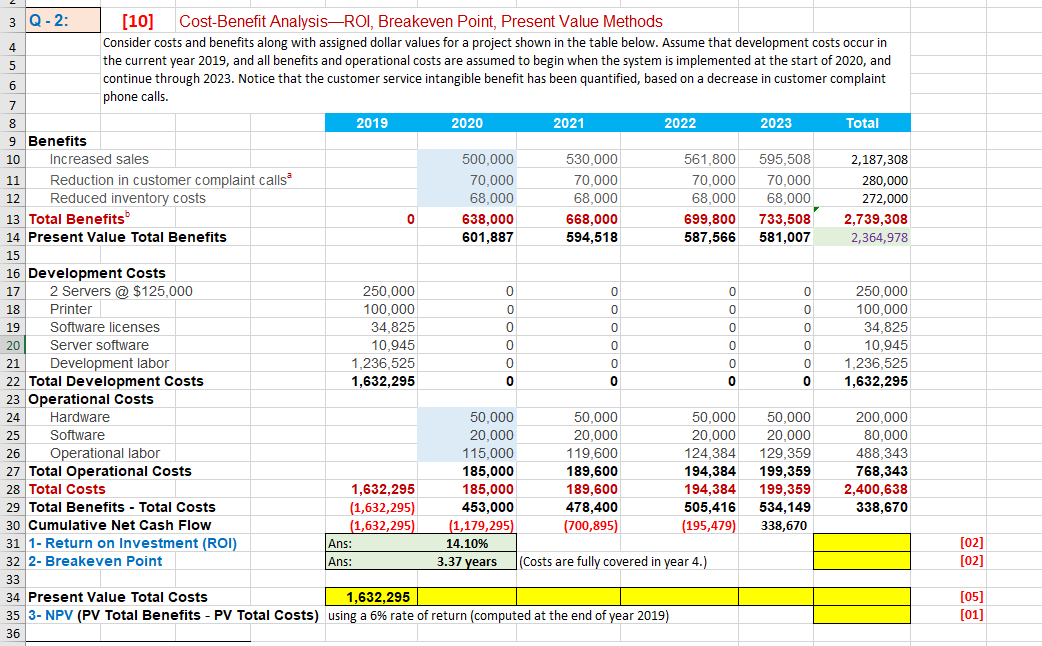
3 Q-2: [10] Cost-Benefit AnalysisROI, Breakeven Point, Present Value Methods 4 Consider costs and benefits along with assigned dollar values for a project shown in the table below. Assume that development costs occur in 5 the current year 2019, and all benefits and operational costs are assumed to begin when the system is implemented at the start of 2020, and 6 continue through 2023. Notice that the customer service intangible benefit has been quantified, based on a decrease in customer complaint phone calls. 7 8 2019 2020 2021 2022 2023 Total 9 Benefits 10 Increased sales 500,000 530,000 561,800 595,508 2,187,308 11 Reduction in customer complaint callsa 70.000 70,000 70,000 70,000 280,000 12 Reduced inventory costs 68,000 68,000 68,000 68,000 272,000 13 Total Benefits 0 638,000 668,000 699,800 733,508 2,739,308 14 Present Value Total Benefits 601,887 594,518 587,566 581,007 2,364,978 15 16 Development Costs 17 2 Servers @ $125,000 250.000 0 0 0 0 250,000 18 Printer 100,000 0 0 0 0 100,000 19 Software licenses 34,825 0 0 0 0 34,825 20 Server software 10,945 0 0 0 0 0 10,945 21 Development labor 1,236.525 0 0 0 0 1,236,525 22 Total Development Costs 1,632,295 0 0 0 0 0 1,632,295 23 Operational Costs 24 Hardware 50,000 50,000 50,000 50,000 200,000 25 Software 20.000 20,000 20,000 20,000 80,000 26 Operational labor 115,000 119.600 124,384 129,359 488,343 27 Total Operational Costs 185,000 189,600 194,384 199,359 768,343 28 Total Costs 1,632.295 185,000 189,600 194,384 199,359 2,400,638 29 Total Benefits - Total Costs (1,632,295) 453,000 478,400 505,416 534,149 338,670 30 Cumulative Net Cash Flow (1,632,295) (1,179,295) (700,895) (195,479) 338,670 31 1 - Return on Investment (ROI) Ans: 14.10% 32 2- Breakeven Point Ans: 3.37 years (Costs are fully covered in year 4.) 33 34 Present Value Total Costs 1,632,295 35 3- NPV (PV Total Benefits - PV Total Costs) using a 6% rate of return (computed at the end of year 2019) 36 [02] [02] [05] [01] [HELP] FINANCIAL CONCEPTS FOR COST-BENEFIT ANALYSIS 1- Return on Investment (ROI): Amount of revenue or cost saving return from a given investment The return on investment (ROI) is a calculation that measures the average rate of return earned on the money invested in the project. A high ROI suggests that the project's benefits far outweigh the project's cost. ROI is a simple calculation that divides the project's net benefits (total benefits - total costs) by the total costs. Although ROI is commonly used in practice, it suffers from several important limitations and should not be used as the only measure of a project's worth. Formula ROI = (Total benefits - total costs)/Total costs 2- Break-Even Point: The point in time at which the costs of the project equal the value it has delivered Another common approach to measuring a project's worth is the break-even point. The break-even point (also called the payback method) is defined as the number of years it takes a firm to recover its original investment in the project from net cash flows. The project's net cash flows pay back" the initial investment during the fourth year; this is the year in which the cumulative cash flow figure becomes positive. Dividing the difference between that year's cash flow and its cumulative cash flow by that year's cash flow determines how far into the year the break-even will occur. The break-even point is easy to calculate and understand and does give an indication of a project's liquidity or the speed at which the project will generate cash returns. Also, projects that produce higher returns early in the project's life are thought to be less risky, since we can anticipate near-term events with more accuracy than we can long-term events. The break-even point does ignore cash flows that occur after the break-even point has been reached and therefore is biased against long-term projects. Formula: (Yearly Net Cash Flow - Cumulative Net Cash Flow)/Yearly Net Cash Flow Use the yearly net cash flow amount from the first year in which the project has a positive cash flow. Add the above amount to the year in which the project has a positive cash flow minus one. 3- Net Present Value: The simple cash flow method, return on investment, and break-even point, as shown in Figure 1-10, all share the weakness of not recognizing the time value of money. In these analyses, the timing of cash flows is ignored. A dollar in year 3 of the project is considered equal to a dollar in year 1. Marvesen value (NPV) is used to compare the present value of all cash inflows and outflows for the project in today's dollar terms. The key to understanding present values is to recognize that if you had a dollar today, you could invest it and receive some rate of return on your investment. Therefore, a dollar received in the future is worth less than a dollar received today, since you forgo that potential return. Appendix 1A shows the present value of a dollar received in the future for different numbers of years and rates of return. If you have a friend who owes you a dollar today, but instead gives you that dollar in three yearsyou've been had! Given a 10% rate of return on an investment, you'll be receiving the equivalent of 75 cents in today's terms. Formula NPV is simply the difference between the total present value of the benefits and the total present value of the costs. As long as the NPV is greater than zero, the project is considered economically feasible. 3 Q-2: [10] Cost-Benefit AnalysisROI, Breakeven Point, Present Value Methods 4 Consider costs and benefits along with assigned dollar values for a project shown in the table below. Assume that development costs occur in 5 the current year 2019, and all benefits and operational costs are assumed to begin when the system is implemented at the start of 2020, and 6 continue through 2023. Notice that the customer service intangible benefit has been quantified, based on a decrease in customer complaint phone calls. 7 8 2019 2020 2021 2022 2023 Total 9 Benefits 10 Increased sales 500,000 530,000 561,800 595,508 2,187,308 11 Reduction in customer complaint callsa 70.000 70,000 70,000 70,000 280,000 12 Reduced inventory costs 68,000 68,000 68,000 68,000 272,000 13 Total Benefits 0 638,000 668,000 699,800 733,508 2,739,308 14 Present Value Total Benefits 601,887 594,518 587,566 581,007 2,364,978 15 16 Development Costs 17 2 Servers @ $125,000 250.000 0 0 0 0 250,000 18 Printer 100,000 0 0 0 0 100,000 19 Software licenses 34,825 0 0 0 0 34,825 20 Server software 10,945 0 0 0 0 0 10,945 21 Development labor 1,236.525 0 0 0 0 1,236,525 22 Total Development Costs 1,632,295 0 0 0 0 0 1,632,295 23 Operational Costs 24 Hardware 50,000 50,000 50,000 50,000 200,000 25 Software 20.000 20,000 20,000 20,000 80,000 26 Operational labor 115,000 119.600 124,384 129,359 488,343 27 Total Operational Costs 185,000 189,600 194,384 199,359 768,343 28 Total Costs 1,632.295 185,000 189,600 194,384 199,359 2,400,638 29 Total Benefits - Total Costs (1,632,295) 453,000 478,400 505,416 534,149 338,670 30 Cumulative Net Cash Flow (1,632,295) (1,179,295) (700,895) (195,479) 338,670 31 1 - Return on Investment (ROI) Ans: 14.10% 32 2- Breakeven Point Ans: 3.37 years (Costs are fully covered in year 4.) 33 34 Present Value Total Costs 1,632,295 35 3- NPV (PV Total Benefits - PV Total Costs) using a 6% rate of return (computed at the end of year 2019) 36 [02] [02] [05] [01] [HELP] FINANCIAL CONCEPTS FOR COST-BENEFIT ANALYSIS 1- Return on Investment (ROI): Amount of revenue or cost saving return from a given investment The return on investment (ROI) is a calculation that measures the average rate of return earned on the money invested in the project. A high ROI suggests that the project's benefits far outweigh the project's cost. ROI is a simple calculation that divides the project's net benefits (total benefits - total costs) by the total costs. Although ROI is commonly used in practice, it suffers from several important limitations and should not be used as the only measure of a project's worth. Formula ROI = (Total benefits - total costs)/Total costs 2- Break-Even Point: The point in time at which the costs of the project equal the value it has delivered Another common approach to measuring a project's worth is the break-even point. The break-even point (also called the payback method) is defined as the number of years it takes a firm to recover its original investment in the project from net cash flows. The project's net cash flows pay back" the initial investment during the fourth year; this is the year in which the cumulative cash flow figure becomes positive. Dividing the difference between that year's cash flow and its cumulative cash flow by that year's cash flow determines how far into the year the break-even will occur. The break-even point is easy to calculate and understand and does give an indication of a project's liquidity or the speed at which the project will generate cash returns. Also, projects that produce higher returns early in the project's life are thought to be less risky, since we can anticipate near-term events with more accuracy than we can long-term events. The break-even point does ignore cash flows that occur after the break-even point has been reached and therefore is biased against long-term projects. Formula: (Yearly Net Cash Flow - Cumulative Net Cash Flow)/Yearly Net Cash Flow Use the yearly net cash flow amount from the first year in which the project has a positive cash flow. Add the above amount to the year in which the project has a positive cash flow minus one. 3- Net Present Value: The simple cash flow method, return on investment, and break-even point, as shown in Figure 1-10, all share the weakness of not recognizing the time value of money. In these analyses, the timing of cash flows is ignored. A dollar in year 3 of the project is considered equal to a dollar in year 1. Marvesen value (NPV) is used to compare the present value of all cash inflows and outflows for the project in today's dollar terms. The key to understanding present values is to recognize that if you had a dollar today, you could invest it and receive some rate of return on your investment. Therefore, a dollar received in the future is worth less than a dollar received today, since you forgo that potential return. Appendix 1A shows the present value of a dollar received in the future for different numbers of years and rates of return. If you have a friend who owes you a dollar today, but instead gives you that dollar in three yearsyou've been had! Given a 10% rate of return on an investment, you'll be receiving the equivalent of 75 cents in today's terms. Formula NPV is simply the difference between the total present value of the benefits and the total present value of the costs. As long as the NPV is greater than zero, the project is considered economically feasible