Answered step by step
Verified Expert Solution
Question
1 Approved Answer
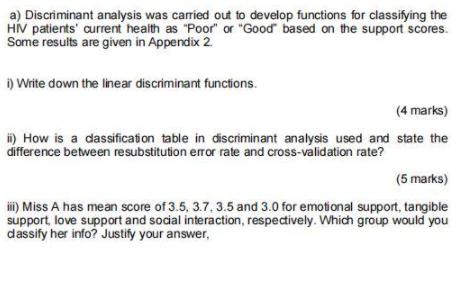
a) Discriminant analysis was carried out to develop functions for classifying the HV patients' current health as Poor or Good based on the support


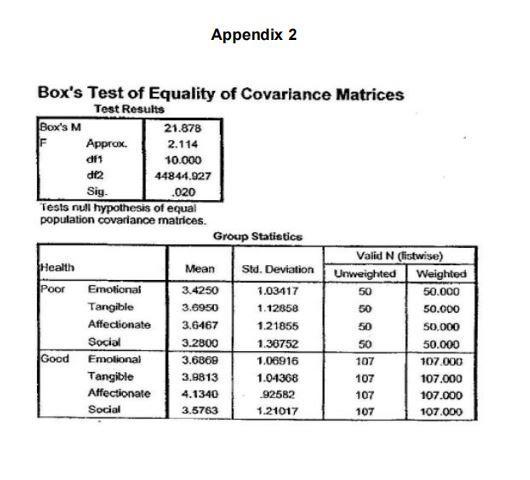
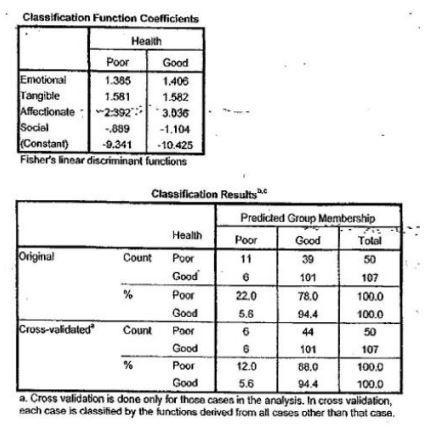
a) Discriminant analysis was carried out to develop functions for classifying the HV patients' current health as "Poor" or "Good based on the support scores. Some results are given in Appendix 2 i) Write down the linear discriminant functions. (4 marks) i) How is a dassification table in discriminant analysis used and state the difference between resubstitution error rate and cross-validation rate? (5 marks) i) Miss A has mean score of 3.5, 3.7, 3.5 and 3.0 for emotional support, tangible support, love support and social interaction, respectively. Which group would you dassify her info? Justify your answer, Appendix 2 Box's Test of Equality of Covariance Matrices Test Results 21.878 Box's M Approx. 2.114 df1 10.000 df2 44844.927 Sig. .020 Tests null hypothesis of equal population covariance matrices. Group Statistics Valid N (istwise) iealth Mean Std. Deviation Unweighted Weighted Poor Emotional 3.4250 1.03417 50 50.000 Tangible 3.6950 1.12858 50 50.000 Affectionate 3.6467 1.21855 50 50,000 Social Good Emolional 3.2800 1.30752 50 50.000 3.6869 1.06916 107 107.000 Tangible Affectionate 3,9813 1.04368 107 107.000 4.1340 92582 107 107.000 Social 3.5763 1.21017 107 107.000 Classification Function Coefficients Health Poor Good Emotional 1.385 1.406 Tangitle Affectionate Social Constant) Fisher's linear discriminant funclions 1.581 1.582 -2392 3.036 -889 -1.104 -9.341 -10.425 Classification Results Predicted Group Membership Health Poor Good Total Original Count Poor 11 39 50 Good 101 107 Poor 22.0 78.0 100.0 Good 5.6 94.4 100.0 Cross-validated Count Poor 44 50 Good 6 101 107 Poor 12.0 88.0 100.0 Good 100.0 a. Cross validation is done only for those cases in the analysis. In cross validation, each case is classified by the functions derived from all cases other than that case, 5.6 94.4
Step by Step Solution
★★★★★
3.49 Rating (152 Votes )
There are 3 Steps involved in it
Step: 1
i Write down the linear discriminant functions The linear discriminant functions are Health Poor 138...
Get Instant Access to Expert-Tailored Solutions
See step-by-step solutions with expert insights and AI powered tools for academic success
Step: 2

Step: 3

Ace Your Homework with AI
Get the answers you need in no time with our AI-driven, step-by-step assistance
Get Started


