Question
A distribution of grades in an introductory statistics course (where A-4, B-3, etc) is: X 0 P(X) 0.11 1 2 3 0.17 0.24 0.32

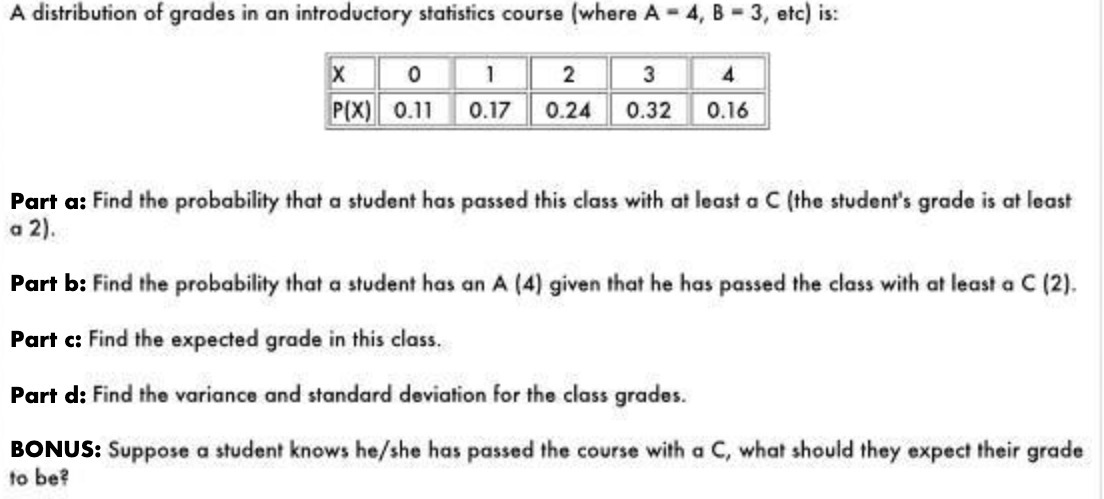
A distribution of grades in an introductory statistics course (where A-4, B-3, etc) is: X 0 P(X) 0.11 1 2 3 0.17 0.24 0.32 4 0.16 Part a: Find the probability that a student has passed this class with at least a C (the student's grade is at least a 2). Part b: Find the probability that a student has an A (4) given that he has passed the class with at least a C (2). Part c: Find the expected grade in this class. Part d: Find the variance and standard deviation for the class grades. BONUS: Suppose a student knows he/she has passed the course with a C, what should they expect their grade to be?
Step by Step Solution
There are 3 Steps involved in it
Step: 1

Get Instant Access to Expert-Tailored Solutions
See step-by-step solutions with expert insights and AI powered tools for academic success
Step: 2

Step: 3

Ace Your Homework with AI
Get the answers you need in no time with our AI-driven, step-by-step assistance
Get StartedRecommended Textbook for
Basic Business Statistics Concepts And Applications
Authors: Mark L. Berenson, David M. Levine, Timothy C. Krehbiel
12th Edition
132168383, 978-0132168380
Students also viewed these Mechanical Engineering questions
Question
Answered: 1 week ago
Question
Answered: 1 week ago
Question
Answered: 1 week ago
Question
Answered: 1 week ago
Question
Answered: 1 week ago
Question
Answered: 1 week ago
Question
Answered: 1 week ago
Question
Answered: 1 week ago
Question
Answered: 1 week ago
Question
Answered: 1 week ago
Question
Answered: 1 week ago
Question
Answered: 1 week ago
Question
Answered: 1 week ago
Question
Answered: 1 week ago
Question
Answered: 1 week ago
Question
Answered: 1 week ago
Question
Answered: 1 week ago
Question
Answered: 1 week ago
Question
Answered: 1 week ago
Question
Answered: 1 week ago
View Answer in SolutionInn App


