

Answered step by step
Verified Expert Solution
Question
1 Approved Answer
A downloadable excel sheet would be appreciated. Problem 1: Power regression using Excel (50 points) A) Create a table like the one shown below. B)
A downloadable excel sheet would be appreciated.
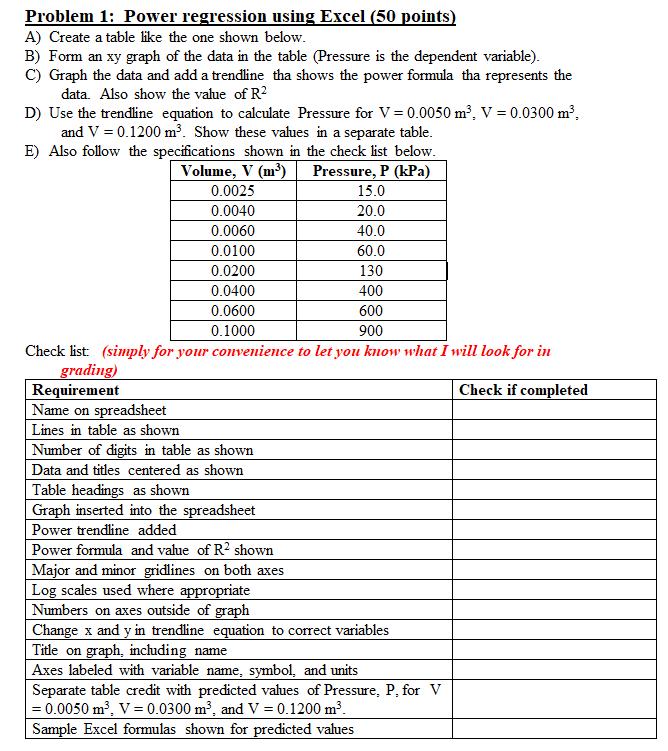
Problem 1: Power regression using Excel (50 points) A) Create a table like the one shown below. B) Form an xy graph of the data in the table (Pressure is the dependent variable). C) Graph the data and add a trendline tha shows the power formula tha represents the data. Also show the value of R2 D) Use the trendline equation to calculate Pressure for V = 0.0050 m? V = 0.0300 m, and V = 0.1200 m. Show these values in a separate table. E) Also follow the specifications shown in the check list below. Volume, V (m) Pressure, P (kPa) 0.0025 15.0 0.0040 20.0 0.0060 40.0 0.0100 60.0 0.0200 130 0.0400 400 0.0600 600 0.1000 900 Check list: (simply for your convenience to let you know what I will look for in grading) Requirement Check if completed Name on spreadsheet Lines in table as shown Number of digits in table as shown Data and titles centered as shown Table headings as shown Graph inserted into the spreadsheet Power trendline added Power formula and value of R2 shown Major and minor gridlines on both axes Log scales used where appropriate Numbers on axes outside of graph Change x and y in trendline equation to correct variables Title on graph, including name Axes labeled with variable name, symbol, and units Separate table credit with predicted values of Pressure. P. for V = 0.0050 m, V = 0.0300 m, and V = 0.1200 m. Sample Excel formulas shown for predicted values Problem 1: Power regression using Excel (50 points) A) Create a table like the one shown below. B) Form an xy graph of the data in the table (Pressure is the dependent variable). C) Graph the data and add a trendline tha shows the power formula tha represents the data. Also show the value of R2 D) Use the trendline equation to calculate Pressure for V = 0.0050 m? V = 0.0300 m, and V = 0.1200 m. Show these values in a separate table. E) Also follow the specifications shown in the check list below. Volume, V (m) Pressure, P (kPa) 0.0025 15.0 0.0040 20.0 0.0060 40.0 0.0100 60.0 0.0200 130 0.0400 400 0.0600 600 0.1000 900 Check list: (simply for your convenience to let you know what I will look for in grading) Requirement Check if completed Name on spreadsheet Lines in table as shown Number of digits in table as shown Data and titles centered as shown Table headings as shown Graph inserted into the spreadsheet Power trendline added Power formula and value of R2 shown Major and minor gridlines on both axes Log scales used where appropriate Numbers on axes outside of graph Change x and y in trendline equation to correct variables Title on graph, including name Axes labeled with variable name, symbol, and units Separate table credit with predicted values of Pressure. P. for V = 0.0050 m, V = 0.0300 m, and V = 0.1200 m. Sample Excel formulas shown for predicted valuesStep by Step Solution
There are 3 Steps involved in it
Step: 1

Get Instant Access to Expert-Tailored Solutions
See step-by-step solutions with expert insights and AI powered tools for academic success
Step: 2

Step: 3
Ace Your Homework with AI
Get the answers you need in no time with our AI-driven, step-by-step assistance
Get Started
Auditor 1 A Person Who Conducts An Audit. 2 Someone Who Arrives After The Battle And Bayonets The Wounded.
Authors: Day By J.
1st Edition
B09NHD98BP, 979-8781611843