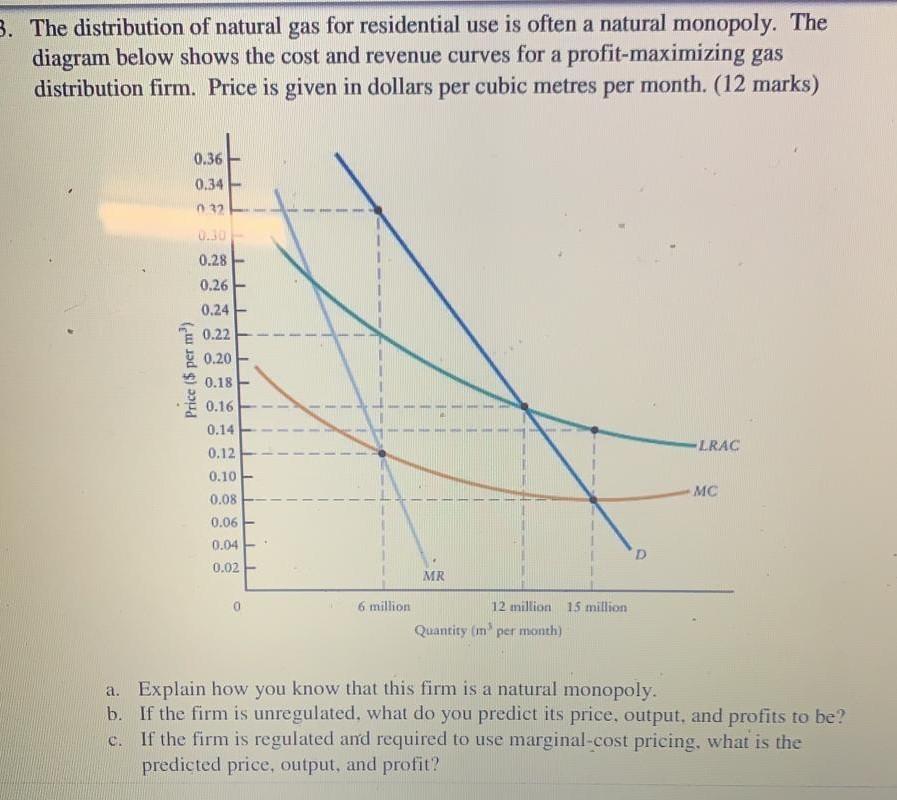
3. The distribution of natural gas for residential use is often a natural monopoly. The diagram below shows the cost and revenue curves for


3. The distribution of natural gas for residential use is often a natural monopoly. The diagram below shows the cost and revenue curves for a profit-maximizing gas distribution firm. Price is given in dollars per cubic metres per month. (12 marks) Price ($ per m) 0.36 0.34 032 0.30 0.28 0.26 0.24 0.22 0.20 0.18 0.16 0.14 0.12 0.10 0.08 0.06 0.04 0.02 1 T 6 million MR 12 million 15 million Quantity (m per month) -LRAC MC a. Explain how you know that this firm is a natural monopoly. b. If the firm is unregulated, what do you predict its price, output, and profits to be? 0. If the firm is regulated and required to use marginal-cost pricing, what is the predicted price, output, and profit? d. If the firm is regulated and required to use average-cost pricing, what is the predicted price, output, and profit? e. What is an important problem with the regulatory policy in part (c)? f. What is an important problem with the regulatory policy in part (d)?
Step by Step Solution
3.42 Rating (152 Votes )
There are 3 Steps involved in it
Step: 1
A firm is natural monopoly Bcoz MC is always below LRAC Bcoz the curre...
See step-by-step solutions with expert insights and AI powered tools for academic success
Step: 2

Step: 3

Ace Your Homework with AI
Get the answers you need in no time with our AI-driven, step-by-step assistance
Get Started


