

Question
A file called avehighs.dat stores the average high temperatures for each month for a year (rounded to integers). The first column of the data stores
A file called avehighs.dat stores the average high temperatures for each month for a year (rounded to integers). The first column of the data stores the zip code, the 2nd to 13th columns store 12 temperatures. For example, the file might store:
65211 33 37 42 45 53 72 82 79 66 55 46 41
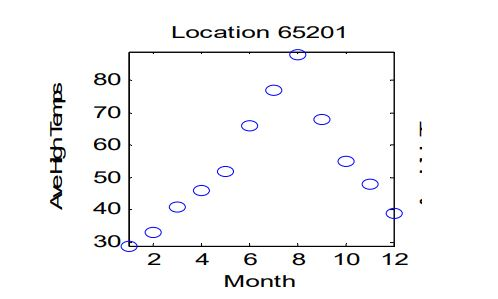
65201 29 33 41 46 52 66 77 88 68 55 48 39
65203 55 62 68 72 75 79 83 89 85 80 77 65
Write a function that will take in one input argument: the zip code. This function will first read in the data file, then find the line corresponding to the zip code, and plot the temperatures for all 12 months. The axis labels and titles should be as shown. The figure title should show the zipcode. For example, if the function is called as ShowTemp(65201), the following graph will be shown:
Step by Step Solution
There are 3 Steps involved in it
Step: 1

Get Instant Access to Expert-Tailored Solutions
See step-by-step solutions with expert insights and AI powered tools for academic success
Step: 2

Step: 3
Ace Your Homework with AI
Get the answers you need in no time with our AI-driven, step-by-step assistance
Get Started
Database Systems Introduction To Databases And Data Warehouses
Authors: Nenad Jukic, Susan Vrbsky, Svetlozar Nestorov
1st Edition
1943153191, 978-1943153190