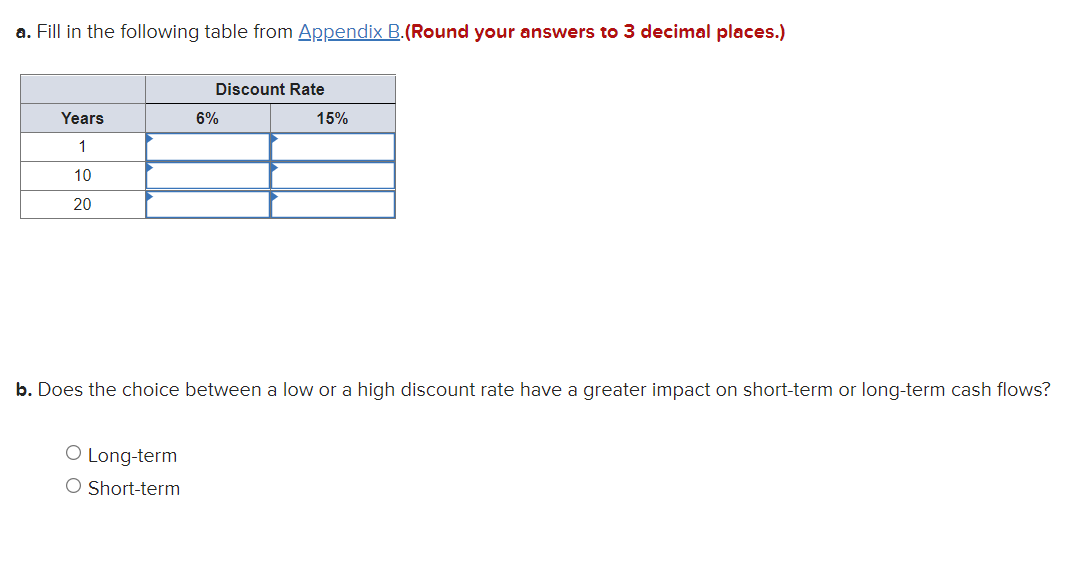
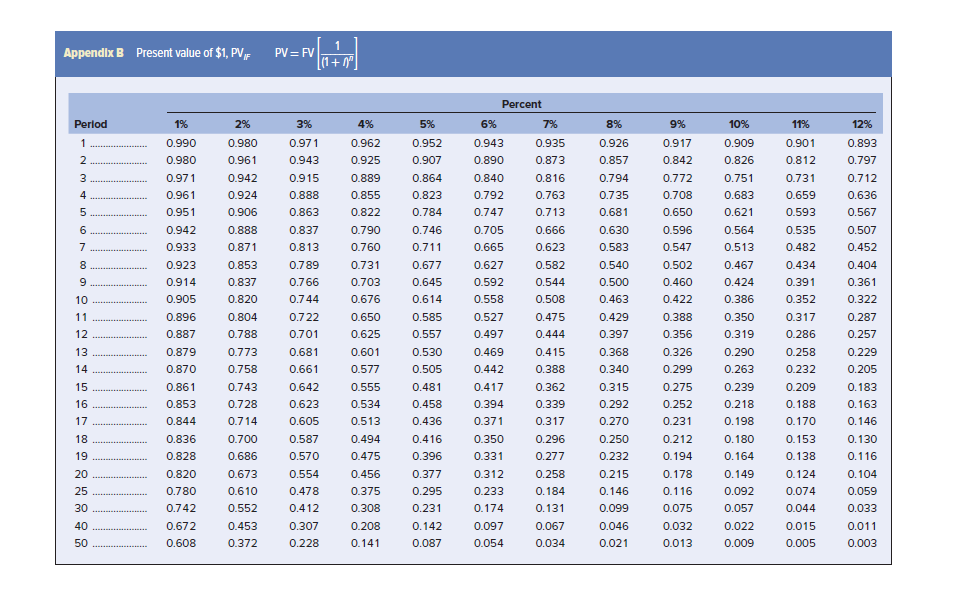
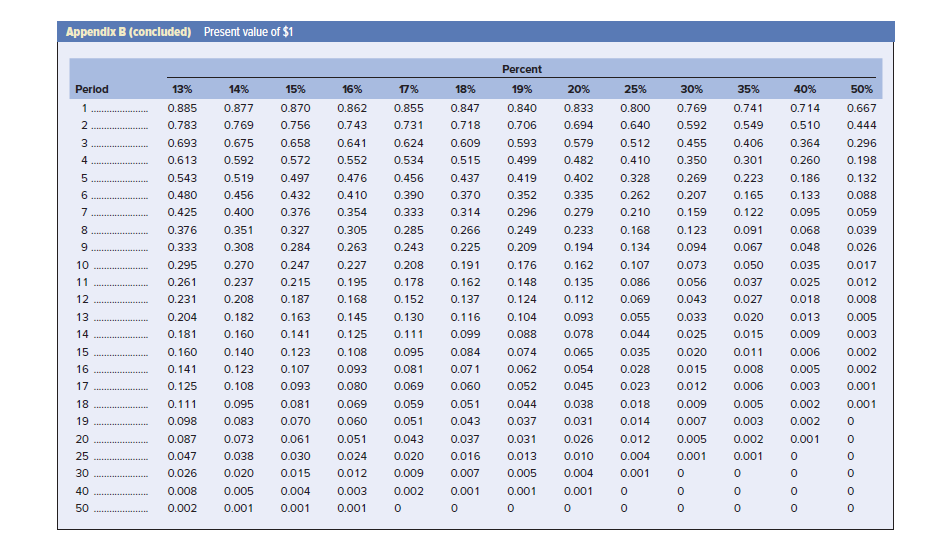
a. Fill in the following table from Appendix B.(Round your answers to 3 decimal places.) Discount Rate Years 6% 15% 1 10 20 b. Does the choice between a low or a high discount rate have a greater impact on short-term or long-term cash flows? O Long-term Short-term Appendix B Present value of $1, PV,F 1 PV = FV ((1+" Percent 4% 6% 7% 8% 9% 10% 11% Period 1 2 1% 0.990 0.980 0.971 0.961 0.951 3 4 5 0.935 0.873 0.816 0.763 0.713 0.901 0.812 0.731 0.659 0.593 0.535 6 7 2% 0.980 0.961 0.942 0.924 0.906 0.888 0.871 0.853 0.837 0.820 0.804 0.788 0.773 0.758 3% 0.971 0.943 0.915 0.888 0.863 0.837 0.813 0.789 0.766 0.744 0.722 0.701 0.681 0.661 0.942 0.933 0.923 0.914 0.905 0.896 0.887 0.879 0.870 0.861 0.853 0.844 0.943 0.890 0.840 0.792 0.747 0.705 0.665 0.627 0.592 0.558 0.527 0.497 0.469 0.442 8 9 5% 0.952 0.907 0.864 0.823 0.784 0.746 0.711 0.677 0.645 0.614 0.585 0.557 0.530 0.505 0.481 0.458 0.436 0.416 0.396 0.377 0.295 0.231 0.142 0.087 0.926 0.857 0.794 0.735 0.681 0.630 0.583 0.540 0.500 0.463 0.429 0.397 0.666 0.623 0.582 0.544 0.508 0.475 0.444 0.962 0.925 0.889 0.855 0.822 0.790 0.760 0.731 0.703 0.676 0.650 0.625 0.601 0.577 0.555 0.534 0.513 0.494 0.475 0.456 0.375 0.308 0.208 0.141 10 11 12 13 14 0.917 0.842 0.772 0.708 0.650 0.596 0.547 0.502 0.460 0.422 0.388 0.356 0.326 0.299 0.909 0.826 0.751 0.683 0.621 0.564 0.513 0.467 0.424 0.386 0.350 0.319 0.290 0.263 0.239 0.218 0.198 0.180 0.164 0.149 0.092 0.057 0.022 0.009 12% 0.893 0.797 0.712 0.636 0.567 0.507 0.452 0.404 0.361 0.322 0.287 0.257 0.229 0.205 0.183 0.163 0.146 0.130 0.116 0.104 0.059 0.033 0.011 0.003 0.415 0.388 0.368 0.340 15 16 17 0.642 0.623 0.605 0.417 0.394 0.371 0.315 0.292 0.270 0.250 0.232 0.587 0.570 0.482 0.434 0.391 0.352 0.317 0.286 0.258 0.232 0.209 0.188 0.170 0.153 0.138 0.124 0.074 0.044 0.015 0.005 18 19 20 25 30 40 50 0.743 0.728 0.714 0.700 0.686 0.673 0.610 0.552 0.453 0.372 0.836 0.828 0.820 0.780 0.742 0.672 0.608 0.362 0.339 0.317 0.296 0.277 0.258 0.184 0.131 0.067 0.034 0.275 0.252 0.231 0.212 0.194 0.178 0.116 0.075 0.032 0.013 0.350 0.331 0.312 0.233 0.174 0.097 0.054 0.554 0.478 0.412 0.307 0.228 0.215 0.146 0.099 0.046 0.021 Appendix B (concluded) Present value of $1 Percent Period 14% 17% 18% 25% 15% 0.870 0.756 0.800 0.640 13% 0.885 0.783 0.693 0.613 0.543 0.480 0.425 4 5 6 7 0.658 0.572 0.497 0.432 0.376 0.847 0.718 0.609 0.515 0.437 0.370 0.314 8 9 0.327 0.284 0.266 0.225 0.376 0.333 0.295 0.261 0.231 10 11 12 0.877 0.769 0.675 0.592 0.519 0.456 0.400 0.351 0.308 0.270 0.237 0.208 0.182 0.160 0.140 0.123 0.108 0.095 0.083 0.073 0.038 0.020 0.005 0.001 16% 0.862 0.743 0.641 0.552 0.476 0.410 0.354 0.305 0.263 0.227 0.195 0.168 0.145 0.125 0.108 0.093 0.080 0.069 0.060 0.051 0.024 0.012 0.003 0.001 0.855 0.731 0.624 0.534 0.456 0.390 0.333 0.285 0.243 0.208 0.178 0.152 0.130 0.111 0.095 0.081 0.069 0.059 0.051 0.043 0.020 0.009 0.002 0 19% 0.840 0.706 0.593 0.499 0.419 0.352 0.296 0.249 0.209 0.176 0.148 0.124 0.104 0.088 0.074 0.062 0.052 0.044 0.037 0.031 0.013 0.005 0.001 0.247 0.215 0.187 0.163 0.141 0.123 0.107 0.093 0.081 0.070 0.061 0.030 0.015 0.004 0.001 20% 0.833 0.694 0.579 0.482 0.402 0.335 0.279 0.233 0.194 0.162 0.135 0.112 0.093 0.078 0.065 0.054 0.045 0.038 0.031 0.026 0.010 0.004 0.001 0 30% 0.769 0.592 0.455 0.350 0.269 0.207 0.159 0.123 0.094 0.073 0.056 0.043 0.033 0.025 0.020 0.015 0.012 0.009 0.007 0.005 0.001 50% 0.667 0.444 0.296 0.198 0.132 0.088 0.059 0.039 0.026 0.017 0.012 0.008 0.005 0.003 0.002 0.002 0.001 0.001 0.191 0.162 0.137 0.116 0.099 0.084 0.071 0.060 0.051 0.043 0.037 0.016 0.007 0.001 0 35% 0.741 0.549 0.406 0.301 0.223 0.165 0.122 0.091 0.067 0.050 0.037 0.027 0.020 0.015 0.011 0.008 0.006 0.005 0.003 0.002 0.001 0.512 0.410 0.328 0.262 0.210 0.168 0.134 0.107 0.086 0.069 0.055 0.044 0.035 0.028 0.023 0.018 0.014 0.012 0.004 0.001 0 0 13 14 40% 0.714 0.510 0.364 0.260 0.186 0.133 0.095 0.068 0.048 0.035 0.025 0.018 0.013 0.009 0.006 0.005 0.003 0.002 0.002 0.001 15 16 17 0.204 0.181 0.160 0.141 0.125 0.111 0.098 0.087 0.047 0.026 0.008 0.002 18 19 20 25 30 40 50 0