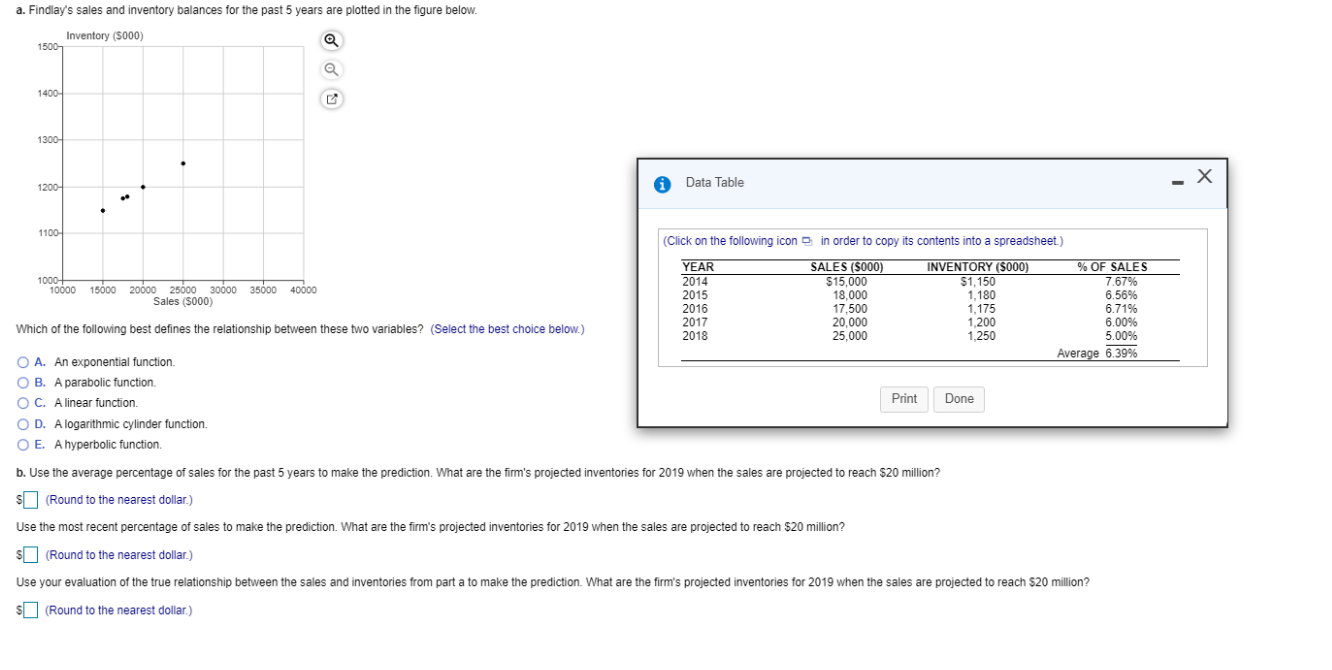
a. Findlay's sales and inventory balances for the past 5 years are plotted in the figure below. Inventory (5000) O 1500 O 1400 S 1300- 12001 A Data Table 11001 (Click on the following icon in order to copy its contents into a spreadsheet.) 1000+ 10000 15000 20000 25000 30000 Sales (5000) 35000 40000 YEAR 2014 2015 2016 2017 2018 SALES (S000) $15,000 18,000 17,500 20.000 25,000 INVENTORY (S000) $1,150 1,180 1,175 1,200 1,250 % OF SALES 7.67% 6.56% 6.71% 6.00% 5.00% Average 6.39% Which of the following best defines the relationship between these two variables? (Select the best choice below.) O A. An exponential function. O B. A parabolic function. O C. A linear function. OD. A logarithmic cylinder function. O E. A hyperbolic function. Print Done b. Use the average percentage of sales for the past 5 years to make the prediction. What are the firm's projected inventories for 2019 when the sales are projected to reach $20 million? (Round to the nearest dollar.) Use the most recent percentage of sales to make the prediction. What are the firm's projected inventories for 2019 when the sales are projected to reach $20 million? s (Round to the nearest dollar.) Use your evaluation of the true relationship between the sales and inventories from part a to make the prediction. What are the firm's projected inventories for 2019 when the sales are projected to reach $20 million? sd (Round to the nearest dollar.) a. Findlay's sales and inventory balances for the past 5 years are plotted in the figure below. Inventory (5000) O 1500 O 1400 S 1300- 12001 A Data Table 11001 (Click on the following icon in order to copy its contents into a spreadsheet.) 1000+ 10000 15000 20000 25000 30000 Sales (5000) 35000 40000 YEAR 2014 2015 2016 2017 2018 SALES (S000) $15,000 18,000 17,500 20.000 25,000 INVENTORY (S000) $1,150 1,180 1,175 1,200 1,250 % OF SALES 7.67% 6.56% 6.71% 6.00% 5.00% Average 6.39% Which of the following best defines the relationship between these two variables? (Select the best choice below.) O A. An exponential function. O B. A parabolic function. O C. A linear function. OD. A logarithmic cylinder function. O E. A hyperbolic function. Print Done b. Use the average percentage of sales for the past 5 years to make the prediction. What are the firm's projected inventories for 2019 when the sales are projected to reach $20 million? (Round to the nearest dollar.) Use the most recent percentage of sales to make the prediction. What are the firm's projected inventories for 2019 when the sales are projected to reach $20 million? s (Round to the nearest dollar.) Use your evaluation of the true relationship between the sales and inventories from part a to make the prediction. What are the firm's projected inventories for 2019 when the sales are projected to reach $20 million? sd (Round to the nearest dollar.)