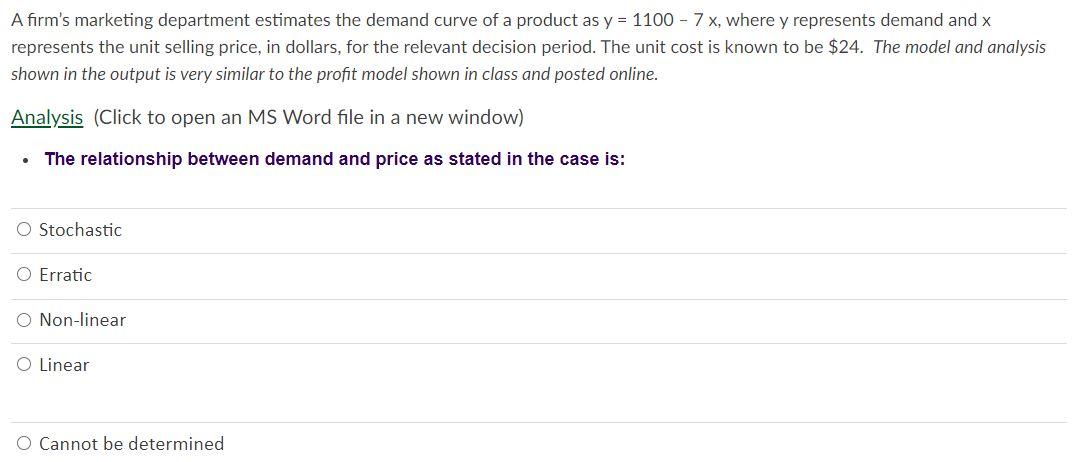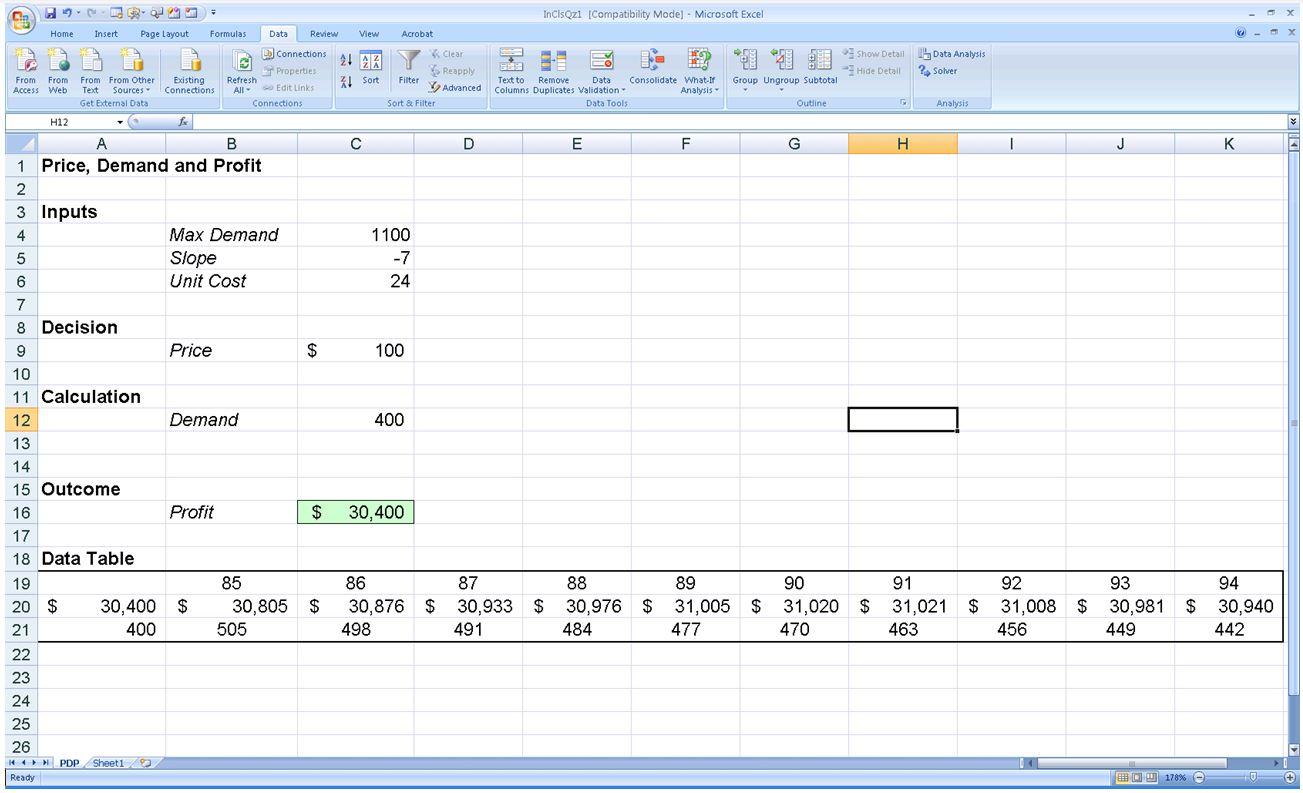

A firm's marketing department estimates the demand curve of a product as y = 1100 - 7x, where y represents demand and x represents the unit selling price, in dollars, for the relevant decision period. The unit cost is known to be $24. The model and analysis shown in the output is very similar to the profit model shown in class and posted online. Analysis (Click to open an MS Word file in a new window) The relationship between demand and price as stated in the case is: O Stochastic Erratic O Non-linear Linear O Cannot be determined X IncisQzi [Compatibility Mode] - Microsoft Excel LE Home Insert Page Layout Formulas Data Review View Acrobat show Detail 15 Data Analysis Hide Detail ? Solver 21 A ! Sort From From Access Web Lo Connections Properties Refresh All Edit Links Connections From From Other Text Sources Get External Data Existing Connections Clear Reapply Filter Advanced Sort & Filter 186 SED Text to Remove Data Consolidate What- Columns Duplicates Validation Analysis Data Tools Group Ungroup Subtotal Outline Analysis H12 D E F G H 1 J fo A B 1 Price, Demand and Profit 2 2. 3 Inputs 4 Max Demand 5 Slope 6 Unit Cost 7 8 Decision 9 9 Price 10 11 Calculation 12 Demand 1100 -7 24 $ 100 400 13 14 15 Outcome 16 17 18 Data Table Profit $ 30,400 19 20 $ 21 30,400 $ 400 85 30,805 $ 505 86 87 88 89 30,876 $ 30,933 $ 30,976 $ 31,005 $ 498 491 484 477 90 91 31,020 $ 31,021 470 463 92 93 94 $ 31,008 $ 30,981 $ 30,940 456 449 442 22 23 24 25 26 HPDP Sheet123 Ready 0 178% A firm's marketing department estimates the demand curve of a product as y = 1100 - 7x, where y represents demand and x represents the unit selling price, in dollars, for the relevant decision period. The unit cost is known to be $24. The model and analysis shown in the output is very similar to the profit model shown in class and posted online. Analysis (Click to open an MS Word file in a new window) The relationship between demand and price as stated in the case is: O Stochastic Erratic O Non-linear Linear O Cannot be determined X IncisQzi [Compatibility Mode] - Microsoft Excel LE Home Insert Page Layout Formulas Data Review View Acrobat show Detail 15 Data Analysis Hide Detail ? Solver 21 A ! Sort From From Access Web Lo Connections Properties Refresh All Edit Links Connections From From Other Text Sources Get External Data Existing Connections Clear Reapply Filter Advanced Sort & Filter 186 SED Text to Remove Data Consolidate What- Columns Duplicates Validation Analysis Data Tools Group Ungroup Subtotal Outline Analysis H12 D E F G H 1 J fo A B 1 Price, Demand and Profit 2 2. 3 Inputs 4 Max Demand 5 Slope 6 Unit Cost 7 8 Decision 9 9 Price 10 11 Calculation 12 Demand 1100 -7 24 $ 100 400 13 14 15 Outcome 16 17 18 Data Table Profit $ 30,400 19 20 $ 21 30,400 $ 400 85 30,805 $ 505 86 87 88 89 30,876 $ 30,933 $ 30,976 $ 31,005 $ 498 491 484 477 90 91 31,020 $ 31,021 470 463 92 93 94 $ 31,008 $ 30,981 $ 30,940 456 449 442 22 23 24 25 26 HPDP Sheet123 Ready 0 178%


