

Question
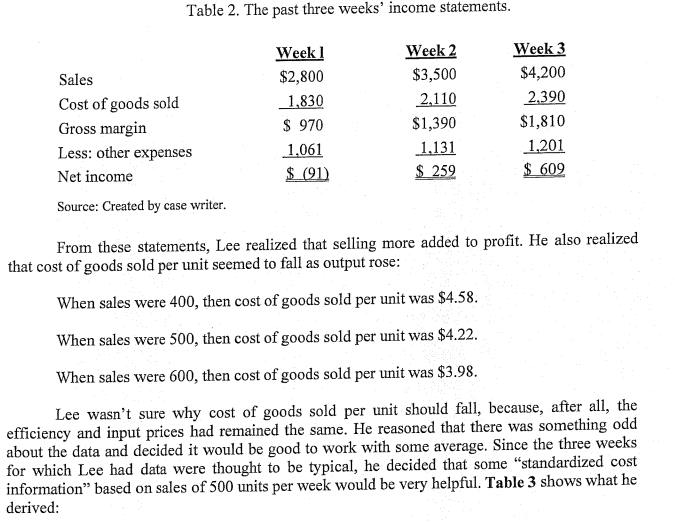
a) Fixed costs; Variable costs and Mixed costs (semi-variable). b) Separate from mixed costs variable cost (per unit) and fixed costs per week. Please show
a) Fixed costs; Variable costs and Mixed costs (semi-variable).
b) Separate from mixed costs variable cost (per unit) and fixed costs per week. Please show calculations.
c) calculate total production fixed costs per week.
d) total production variable cost per unit.
e) total non-production variable cost per unit?
f) total non-production fixed costs per week.
g) total fixed costs per week
h) total variable cost per unit?
i) If the selling price of the product is $ 7.00, how much is the contribution margin per unit?
j) If the selling price of the product is 7.00, What is the break-even point in units?
k) If (Table 5) selling price is $8.00 , commission increases to $ 1.20 per unit . How much is the contribution margin per unit? What is the break-even point in units?
Step by Step Solution
There are 3 Steps involved in it
Step: 1

Get Instant Access to Expert-Tailored Solutions
See step-by-step solutions with expert insights and AI powered tools for academic success
Step: 2

Step: 3
Ace Your Homework with AI
Get the answers you need in no time with our AI-driven, step-by-step assistance
Get Started
Managerial Accounting Method And Meaning Teachers Guide
Authors: R.M.S. Wilson
2nd Edition
0412436205, 978-0412436208