Answered step by step
Verified Expert Solution
Question
1 Approved Answer
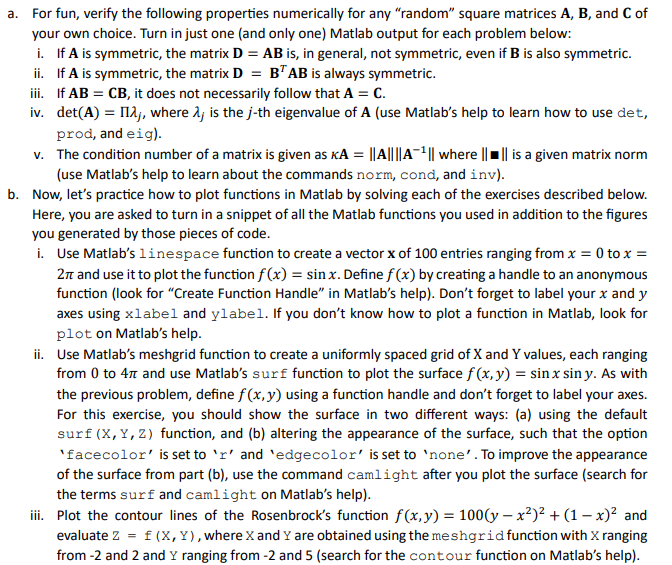
a . For fun, verify the following properties numerically for any random square matrices A , B , and C of your own choice. Turn
a For fun, verify the following properties numerically for any "random" square matrices and of
your own choice. Turn in just one and only one Matlab output for each problem below:
i If is symmetric, the matrix is in general, not symmetric, even if is also symmetric.
ii If is symmetric, the matrix is always symmetric.
iii. If it does not necessarily follow that
iv det where is the th eigenvalue of use Matlab's help to learn how to use det,
prod, and eig
v The condition number of a matrix is given as where is a given matrix norm
use Matlab's help to learn about the commands norm, cond, and inv
b Now, let's practice how to plot functions in Matlab by solving each of the exercises described below.
Here, you are asked to turn in a snippet of all the Matlab functions you used in addition to the figures
you generated by those pieces of code.
i Use Matlab's inespace function to create a vector of entries ranging from to
and use it to plot the function Define by creating a handle to an anonymous
function look for "Create Function Handle" in Matlab's help Don't forget to label your and
axes using xlabel and ylabel. If you don't know how to plot a function in Matlab, look for
plot on Matlab's help.
ii Use Matlab's meshgrid function to create a uniformly spaced grid of and values, each ranging
from to and use Matlab's surf function to plot the surface As with
the previous problem, define using a function handle and don't forget to label your axes.
For this exercise, you should show the surface in two different ways: a using the default
surf function, and b altering the appearance of the surface, such that the option
of the surface from part b use the command camlight after you plot the surface search for
the terms surf and camlight on Matlab's help
iii. Plot the contour lines of the Rosenbrock's function and
evaluate where and are obtained using the meshgrid function with ranging
from and and ranging from and search for the cont our function on Matlab's help

Step by Step Solution
There are 3 Steps involved in it
Step: 1

Get Instant Access to Expert-Tailored Solutions
See step-by-step solutions with expert insights and AI powered tools for academic success
Step: 2

Step: 3

Ace Your Homework with AI
Get the answers you need in no time with our AI-driven, step-by-step assistance
Get Started


