

Question
a. Forecast the parts of the income statement and balance sheets necessary to calculate free cash flow. Partial Income Statement for the Year Ending December
| a. Forecast the parts of the income statement and balance sheets necessary to calculate free cash flow. | ||||
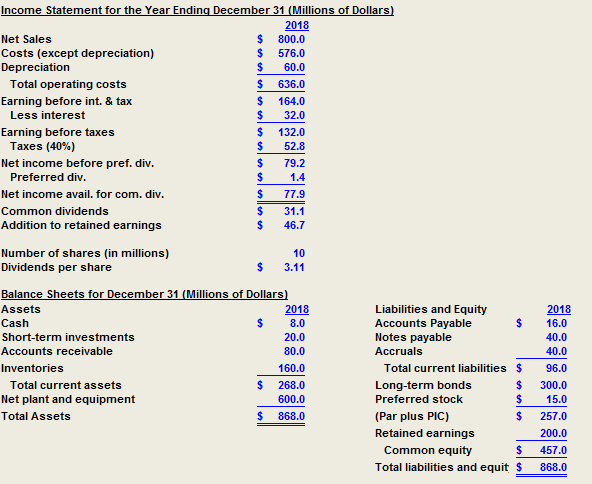
| Partial Income Statement for the Year Ending December 31 (Millions of Dollars) | ||||
|
| Actual | Projected | Projected | |
| Income Statement Items | 2018/12/31 | 12/31/19 | 12/31/20 | |
| Net Sales | $800.0 |
|
| |
| Costs (except depreciation) | $576.0 |
|
| |
| Depreciation | $60.0 |
|
| |
| Total operating costs | $636.0 |
|
| |
| Earning before int. & tax | $164.0 |
|
| |
| Partial Balance Sheets for December 31 (Millions of Dollars) | ||||
|
| Actual | Projected | Projected | |
| Operating Assets | 2018/12/31 | 12/31/19 | 12/31/20 | |
| Cash | $8.0 |
|
| |
| Accounts receivable | $80.0 |
|
| |
| Inventories | $160.0 |
|
| |
| Net plant and equipment | $600.0 |
|
| |
|
|
|
|
| |
| Operating Liabilities |
|
|
| |
| Accounts Payable | $16.0 |
|
| |
| Accruals | $40.0 |
|
| |
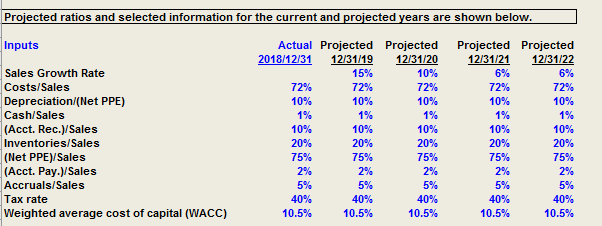
| b. Calculate free cash flow for each projected year. Also calculate the growth rates of free cash flow each year to ensure that there is constant growth (i.e., the same as the constant growth rate in sales) by the end of the forecast period. | ||||
| Actual | Projected | Projected | ||
| Calculation of FCF | 2018/12/31 | 12/31/19 | 12/31/20 | |
| Operating current assets |
|
|
| |
| Operating current liabilities |
|
|
| |
| Net operating working capital |
|
|
| |
| Net PPE |
|
|
| |
| Total net operating capital |
|
|
| |
| NOPAT |
|
|
| |
| Investment in total net operating capital | na |
|
| |
| Free cash flow | na |
|
| |
| Growth in FCF | na | na |
| |
| Growth in sales |
|
|
| |
|
| ||||
Step by Step Solution
There are 3 Steps involved in it
Step: 1

Get Instant Access to Expert-Tailored Solutions
See step-by-step solutions with expert insights and AI powered tools for academic success
Step: 2

Step: 3
Ace Your Homework with AI
Get the answers you need in no time with our AI-driven, step-by-step assistance
Get Started
Introduction to Finance Markets Investments and Financial Management
Authors: Melicher Ronald, Norton Edgar
15th edition
9781118800720, 1118492676, 1118800729, 978-1118492673