

Answered step by step
Verified Expert Solution
Question
1 Approved Answer
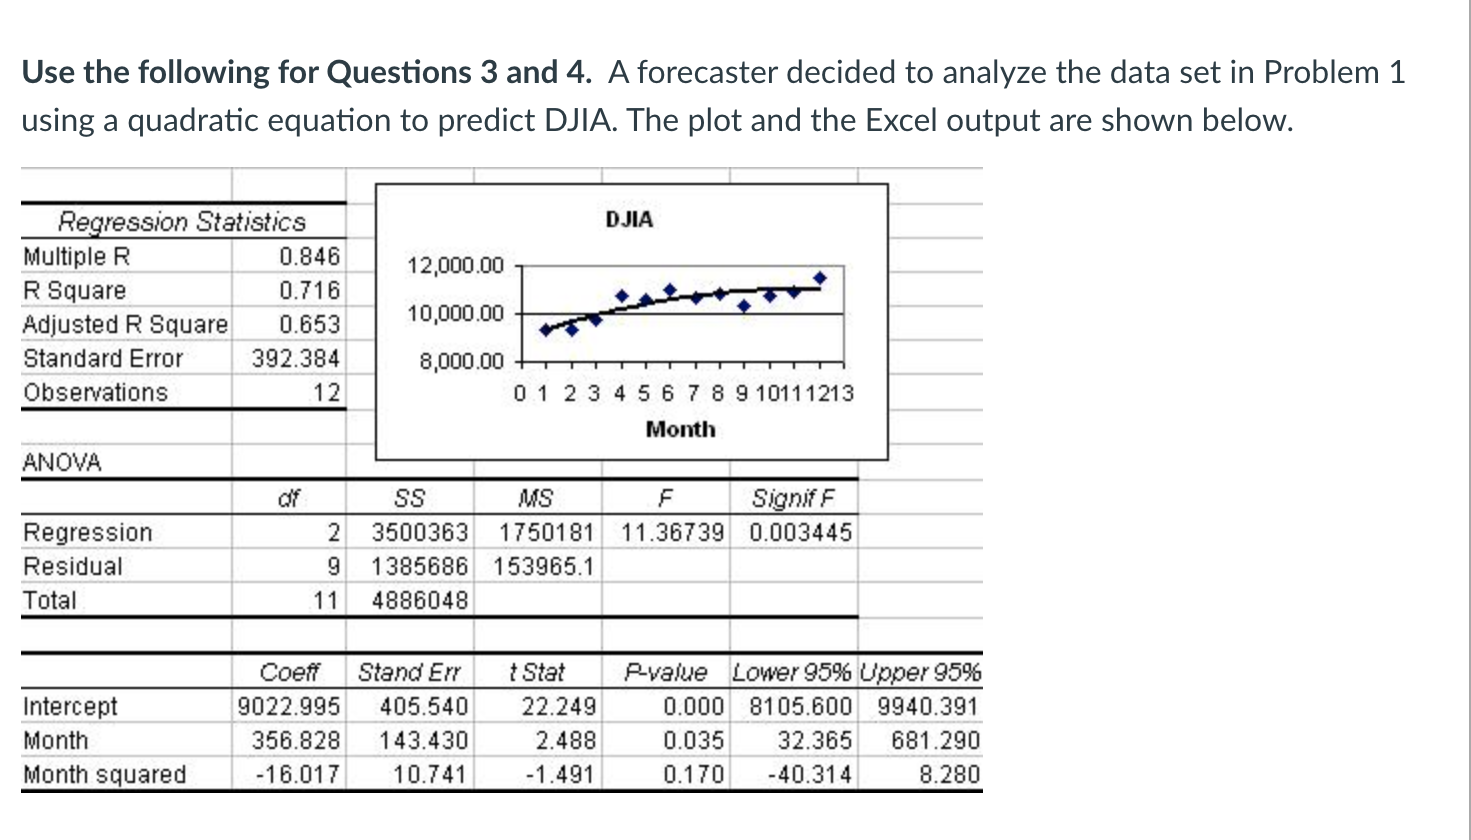
A forecaster decided to analyze the data set in Problem 1 using a quadratic equation to predict DJIA. The plot and the Excel output are
A forecaster decided to analyze the data set in Problem 1 using a quadratic equation to predict DJIA. The plot and the Excel output are shown below.
Step by Step Solution
There are 3 Steps involved in it
Step: 1

Get Instant Access to Expert-Tailored Solutions
See step-by-step solutions with expert insights and AI powered tools for academic success
Step: 2

Step: 3
Ace Your Homework with AI
Get the answers you need in no time with our AI-driven, step-by-step assistance
Get Started
Discrete Structures, Logic, And Computability
Authors: James L Hein
3rd Edition
1449615279, 9781449615277