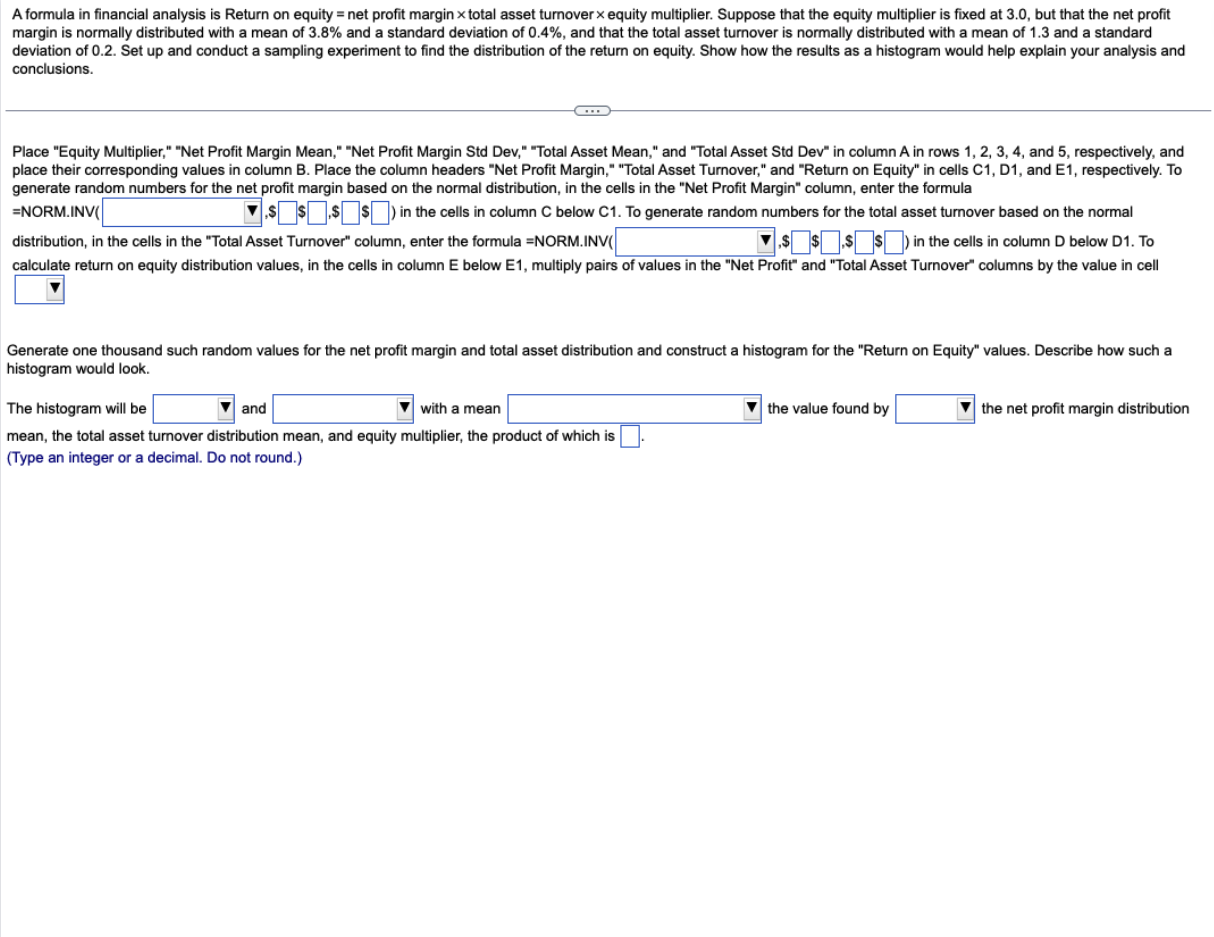
A formula in financial analysis is Return on equity = net profit margin total asset turnover equity multiplier. Suppose that the equity multiplier is fixed at 3.0, but that the net profit margin is normally distributed with a mean of 3.8% and a standard deviation of 0.4%, and that the total asset turnover is normally distributed with a mean of 1.3 and a standard conclusions. Place "Equity Multiplier," "Net Profit Margin Mean," "Net Profit Margin Std Dev," "Total Asset Mean," and "Total Asset Std Dev" in column A in rows 1, 2, 3, 4, and 5, respectively, and place their corresponding values in column B. Place the column headers "Net Profit Margin," "Total Asset Turnover," and "Return on Equity" in cells C1, D1, and E1, respectively. To generate random numbers for the net profit margin based on the normal distribution, in the cells in the "Net Profit Margin" column, enter the formula =NORM.INV( $$; in in the cells in column C below C1. To generate random numbers for the total asset turnover based on the normal calculate return on equity distribution values, in the cells in column E below E1, multiply pairs of values in the "Net Profit" and "Total Asset Turnover" columns by the value in Generate one thousand such random values for the net profit margin and total asset distribution and construct a histogram for the "Return on Equity" values. Describe how such a histogram would look. mean, the total asset turnover distribution mean, and equity multiplier, the product of which is (Type an integer or a decimal. Do not round.) A formula in financial analysis is Return on equity = net profit margin total asset turnover equity multiplier. Suppose that the equity multiplier is fixed at 3.0, but that the net profit margin is normally distributed with a mean of 3.8% and a standard deviation of 0.4%, and that the total asset turnover is normally distributed with a mean of 1.3 and a standard conclusions. Place "Equity Multiplier," "Net Profit Margin Mean," "Net Profit Margin Std Dev," "Total Asset Mean," and "Total Asset Std Dev" in column A in rows 1, 2, 3, 4, and 5, respectively, and place their corresponding values in column B. Place the column headers "Net Profit Margin," "Total Asset Turnover," and "Return on Equity" in cells C1, D1, and E1, respectively. To generate random numbers for the net profit margin based on the normal distribution, in the cells in the "Net Profit Margin" column, enter the formula =NORM.INV( $$; in in the cells in column C below C1. To generate random numbers for the total asset turnover based on the normal calculate return on equity distribution values, in the cells in column E below E1, multiply pairs of values in the "Net Profit" and "Total Asset Turnover" columns by the value in Generate one thousand such random values for the net profit margin and total asset distribution and construct a histogram for the "Return on Equity" values. Describe how such a histogram would look. mean, the total asset turnover distribution mean, and equity multiplier, the product of which is (Type an integer or a decimal. Do not round.)


