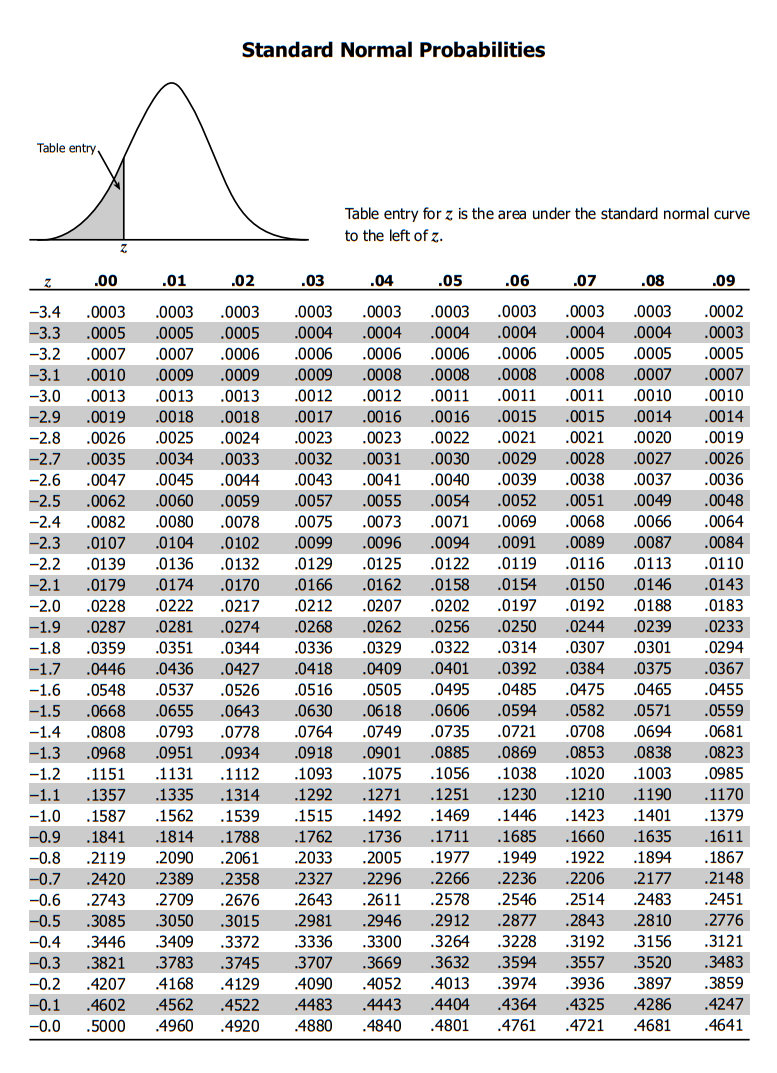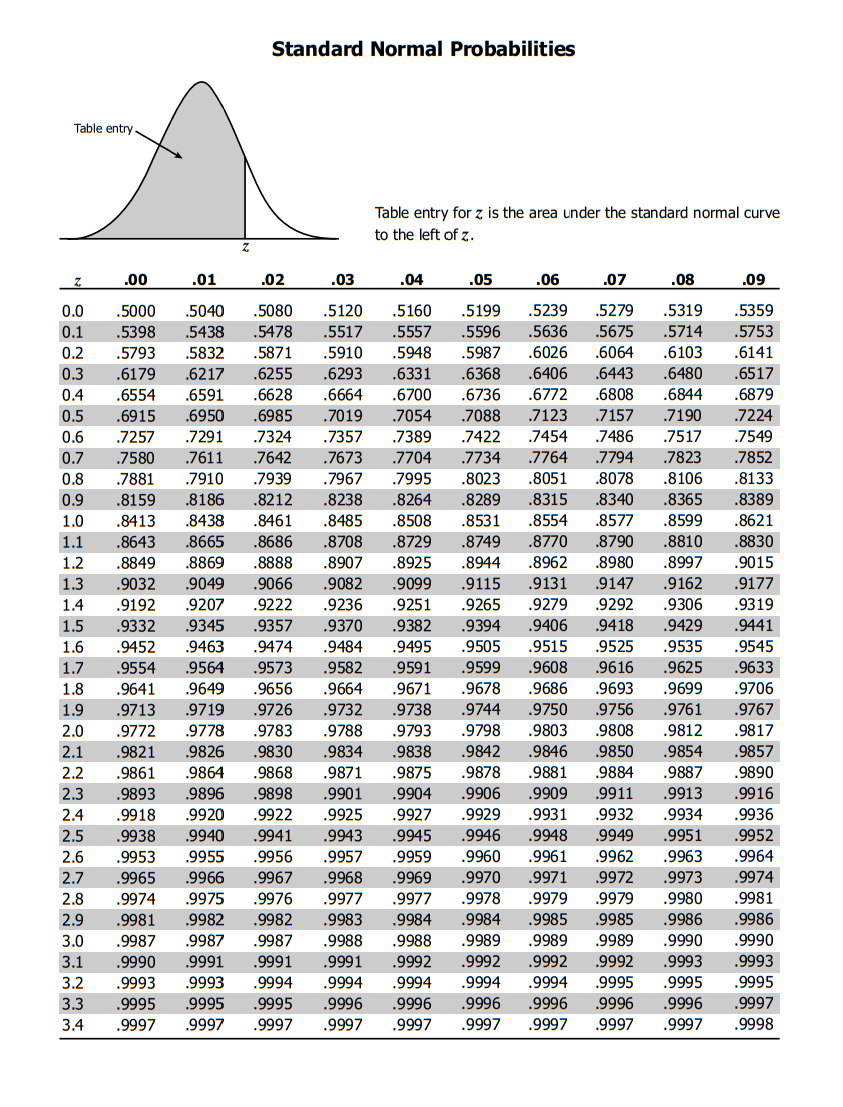
A Gallup Poll in May 2010 showed that 669 out of 1029 randomly chosen adults said that the death penalty was "morally acceptable." In 1996, the rate of support for the death penalty was 78%. Using the data from 2010. we want to test if the rate of support has decreased since 1996. Find the appropriate test statistic and p-value for the test.
Standard Normal Probabilities Table entry Table entry for z is the area under the standard normal curve to the left of z. .00 .01 .02 .03 .04 05 06 07 .08 09 -3.4 .0003 .0003 .0003 .0003 .0003 .0003 .0003 .0003 .0003 .0002 -3.3 .0005 .0005 .0005 .0004 .0004 .0004 .0004 0004 0004 0003 -3.2 .0007 .0007 0006 0006 .0006 0006 0006 .0005 0005 0005 -3.1 .0010 .0009 .0009 .0009 .0008 .0008 0008 .0008 .0007 0007 -3.0 .0013 .0013 0013 0012 .0012 0011 0011 .0011 0010 0010 -2.9 .0019 .0018 .0018 0017 0016 .0016 0015 0015 0014 .0014 -2.8 .0026 .0025 .0024 .0023 .0023 .0022 .0021 .0021 0020 0019 -2.7 0035 .0034 0033 0032 0031 0030 0029 0028 0027 0026 -2.6 .0047 .0045 .0044 .0043 .0041 .0040 0039 .0038 .0037 .0036 -2.5 0062 .0060 0059 0057 0055 0054 0052 0051 0049 0048 -2.4 0082 .0080 0078 0075 0073 0071 .0069 .0068 0066 .0064 -2.3 .0107 .0104 .0102 0099 0096 .0094 0091 0089 0087 0084 -2.2 .0139 .0136 .0132 0129 .0125 .0122 0119 .0116 0113 0110 -2.1 0179 .0174 .0170 0166 .0162 .0158 0154 .0150 0146 0143 -2.0 .0228 0222 0217 0212 .0207 0202 .0197 .0192 0188 .0183 -1.9 0287 .0281 .0274 0268 .0262 .0256 .0250 .0244 0239 .0233 -1.8 .0359 .0351 .0344 0336 .0329 .0322 0314 0307 0301 0294 -1.7 0446 .0436 .0427 0418 0409 .0401 0392 .0384 .0375 0367 -1.6 .0548 .0537 .0526 .0516 .0505 0495 .0485 0475 0465 .0455 -1.5 0668 0655 0643 0630 0618 0606 0594 .0582 0571 0559 -1.4 .0808 .0793 0778 .0764 0749 .0735 0721 .0708 .0694 .0681 -1.3 .0968 0951 0934 0918 0901 0885 0869 .0853 0838 0823 -1.2 .1151 .1131 .1112 1093 1075 .1056 .1038 1020 1003 .0985 -1.1 .1357 .1335 .1314 1292 1271 .1251 .1230 1210 1190 1170 -1.0 .1587 .1562 .1539 .1515 .1492 .1469 1446 1423 .1401 1379 -0.9 .1841 .1814 1788 1762 1736 1711 .1685 1660 1635 .1611 -0.8 .2119 .2090 .2061 .2033 .2005 .1977 .1949 1922 1894 1867 -0.7 .2420 .2389 .2358 .2327 .2296 .2266 .2236 .2206 .2177 .2148 -0.6 .2743 .2709 .2676 .2643 .2611 .2578 .2546 .2514 .2483 .2451 -0.5 3085 .3050 .3015 2981 2946 .2912 2877 2843 .2810 .2776 -0.4 3446 .3409 .3372 .3336 .3300 .3264 .3228 .3192 .3156 .3121 -0.3 .3821 .3783 3745 .3707 3669 .3632 .3594 3557 3520 .3483 -0.2 . 4207 .4168 .4129 .4090 . 4052 . 4013 .3974 .3936 .3897 .3859 -0.1 .4602 .4562 .4522 4483 .4443 4404 4364 4325 4286 4247 -0.0 5000 .4960 .4920 .4880 .4840 .4801 .4761 .4721 .4681 .4641Standard Normal Probabilities Table entry Table entry for z is the area under the standard normal curve to the left of z. 7. .00 01 .02 03 04 05 .06 .07 08 .09 0.0 .5000 .5040 .5080 .5120 .5160 .5199 .5239 .5279 .5319 .5359 0.1 .5398 5438 .5478 5517 5557 .5596 5636 .5675 5714 5753 0.2 5793 5832 .5871 .5910 5948 5987 .6026 6064 6103 6141 0.3 6179 .6217 6255 6293 6331 6368 .6406 .6443 6480 6517 0.4 6554 6591 6628 .6664 6700 6736 6772 .6808 6844 6879 0.5 6915 6950 6985 .7019 7054 7088 .7123 .7157 .7190 7224 0.6 .7257 .7291 7324 .7357 .7389 .7422 .7454 .7486 .7517 .7549 0.7 .7580 .7611 .7642 .7673 .7704 7734 .7764 .7794 .7823 .7852 0.8 .7881 .7910 .7939 .7967 .7995 8023 .8051 .8078 .8106 .8133 0.9 8159 .8186 .8212 8238 8264 8289 .8315 .8340 8365 8389 1.0 .8413 .8438 .8461 8485 .8508 .8531 .8554 .8577 .8599 .8621 1.1 8643 .8665 8686 8708 8729 8749 8770 .8790 .8810 8830 1.2 8849 .8869 8888 .8907 .8925 .8944 .8962 .8980 .8997 9015 1.3 9032 9049 9066 9082 9099 .9115 .9131 9147 9162 9177 1.4 9192 .9207 9222 9236 9251 .9265 .9279 .9292 .9306 .9319 1.5 9332 .9345 9357 9370 9382 9394 .9406 .9418 9429 .9441 1.6 9452 .9463 9474 9484 9495 9505 .9515 .9525 9535 .9545 1.7 9554 .9564 9573 9582 9591 .9599 .9608 .9616 .9625 .9633 1.8 9641 .9649 .9656 .9664 .9671 .9678 .9686 .9693 .9699 9706 1.9 9713 .9719 9726 9732 9738 9744 9750 9756 9761 9767 2.0 9772 .9778 9783 9788 9793 9798 .9803 .9808 .9812 .9817 2.1 9821 9826 9830 9834 9838 9842 9846 .9850 9854 9857 2.2 9861 .9864 9868 .9871 9875 9878 .9881 .9884 9887 .9890 2.3 9893 .9896 9898 .9901 .9904 .9906 .9909 .9911 .9913 9916 2.4 .9918 .9920 9922 9925 9927 .9929 .9931 .9932 .9934 9936 2.5 9938 9940 9941 9943 9945 9946 9948 .9949 9951 9952 2.6 9953 .9955 9956 9957 9959 9960 9961 .9962 9963 9964 2.7 9965 9966 9967 9968 9969 .9970 9971 .9972 9973 9974 2.8 9974 9975 9976 9977 9977 9978 9979 .9979 9980 9981 2.9 9981 .9982 .9982 9983 9984 9984 9985 .9985 9986 9986 3.0 9987 .9987 9987 9988 9988 .9989 .9989 .9989 .9990 9990 3.1 9990 9991 9991 9991 9992 9992 9992 .9992 .9993 9993 3.2 .9993 .9993 9994 .9994 9994 9994 .9994 .9995 9995 .9995 3.3 9995 9995 9995 9996 9996 .9996 .9996 9996 9996 9997 3.4 .9997 .9997 .9997 .9997 .9997 9997 .9997 .9997 .9997 .9998