

Question: A graph of position versus time for a certain particle moving along the x axis is shown in the figure below. Find the average
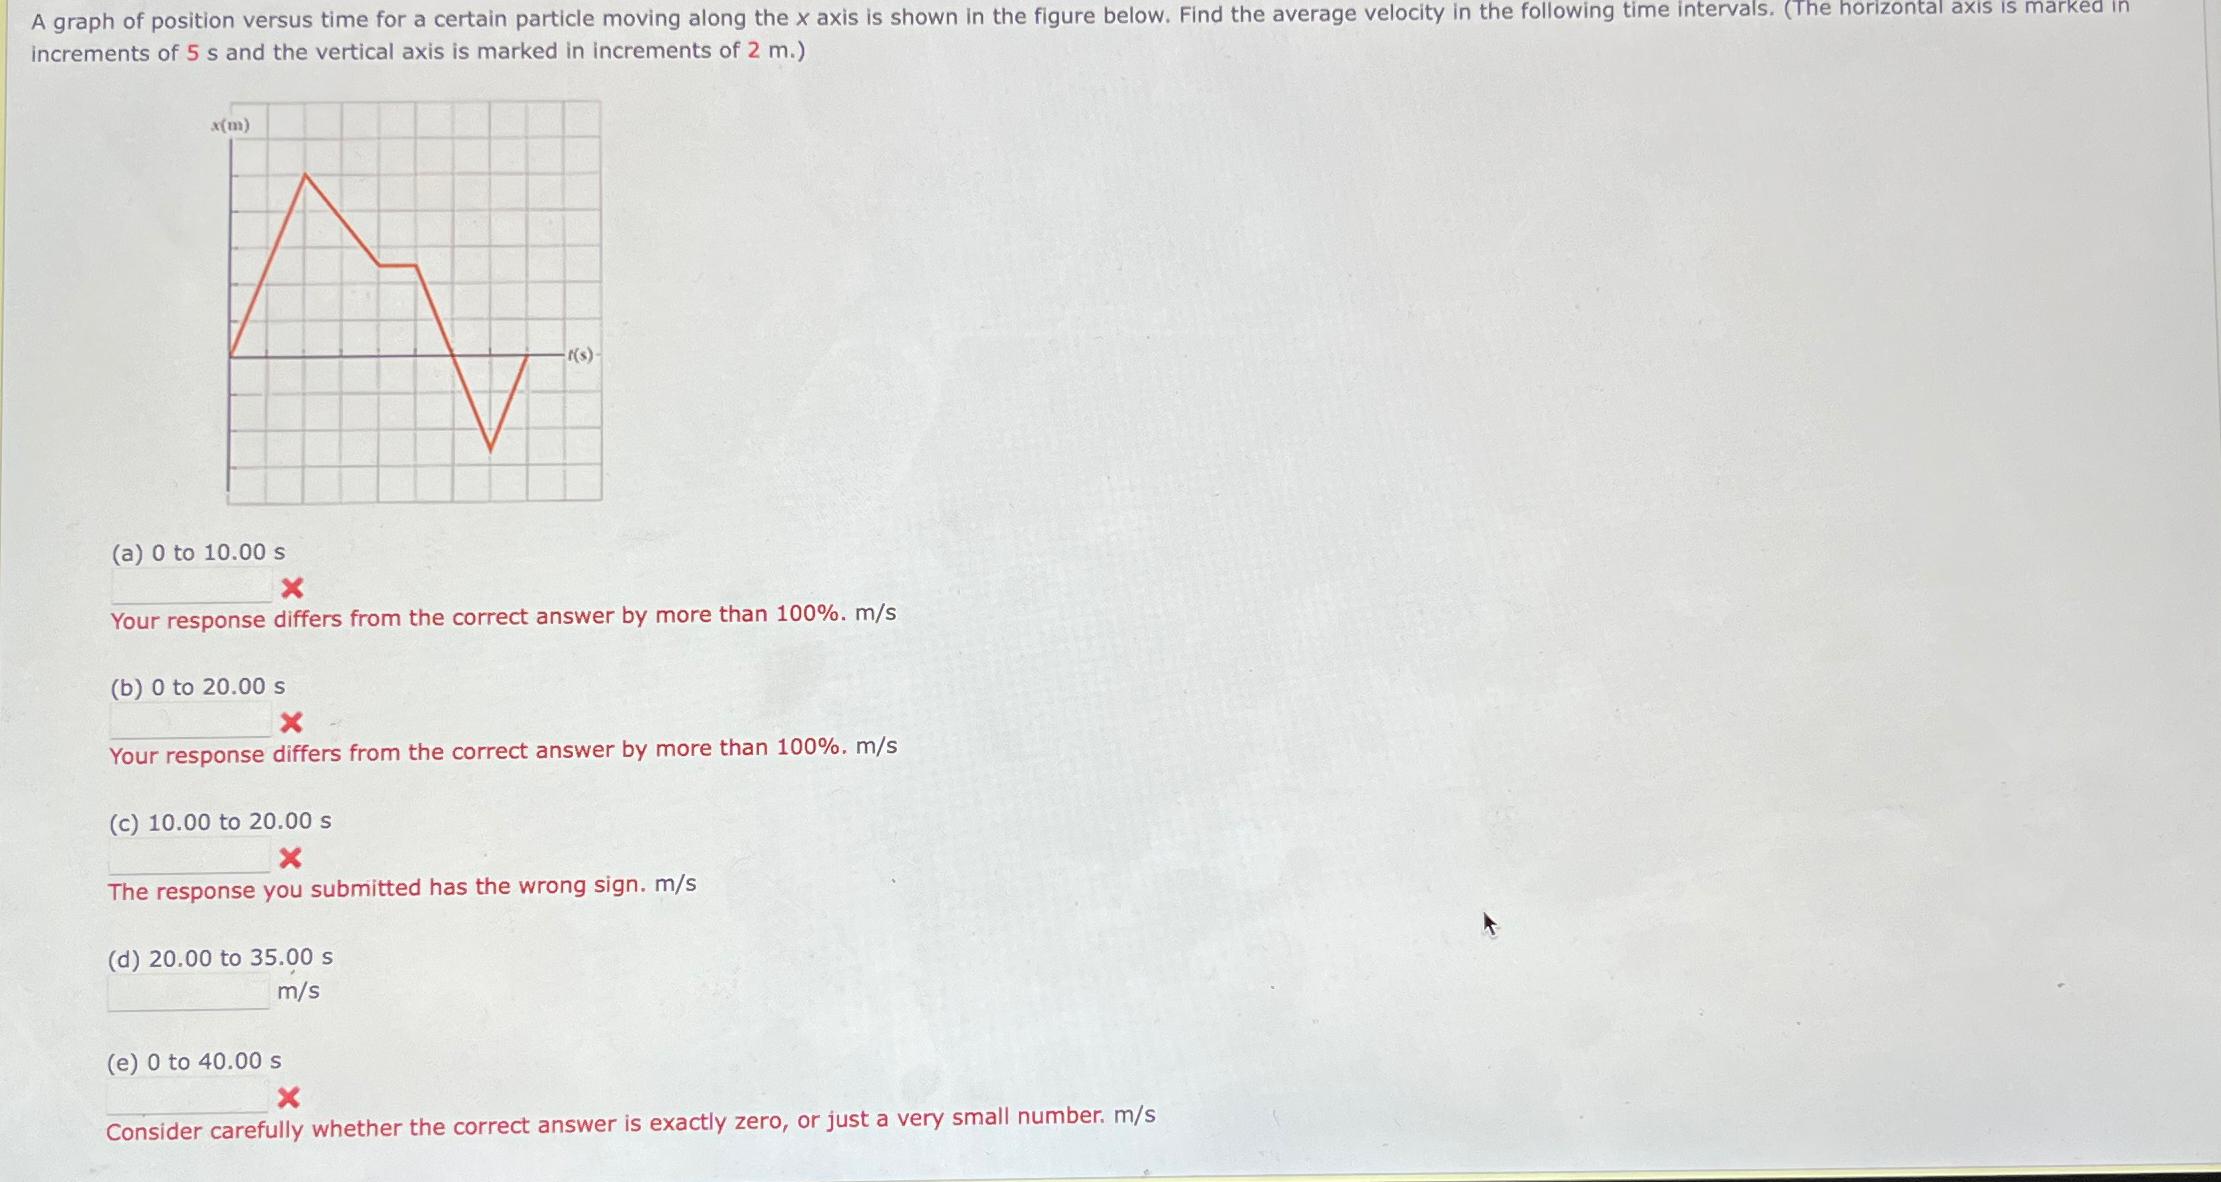
A graph of position versus time for a certain particle moving along the x axis is shown in the figure below. Find the average velocity in the following time intervals. (The horizontal axis is marked in increments of 5 s and the vertical axis is marked in increments of 2 m.) x(m) (a) 0 to 10.00 s X Your response differs from the correct answer by more than 100%. m/s (b) 0 to 20.00 s X Your response differs from the correct answer by more than 100%. m/s (c) 10.00 to 20.00 s The response you submitted has the wrong sign. m/s (d) 20.00 to 35.00 s m/s (e) 0 to 40.00 s X Consider carefully whether the correct answer is exactly zero, or just a very small number. m/s
Step by Step Solution
There are 3 Steps involved in it
Solutions Step 1 average velocity x2x1t2t1 a average velocity x2x1t2t1 10 01000 0 ... View full answer

Get step-by-step solutions from verified subject matter experts